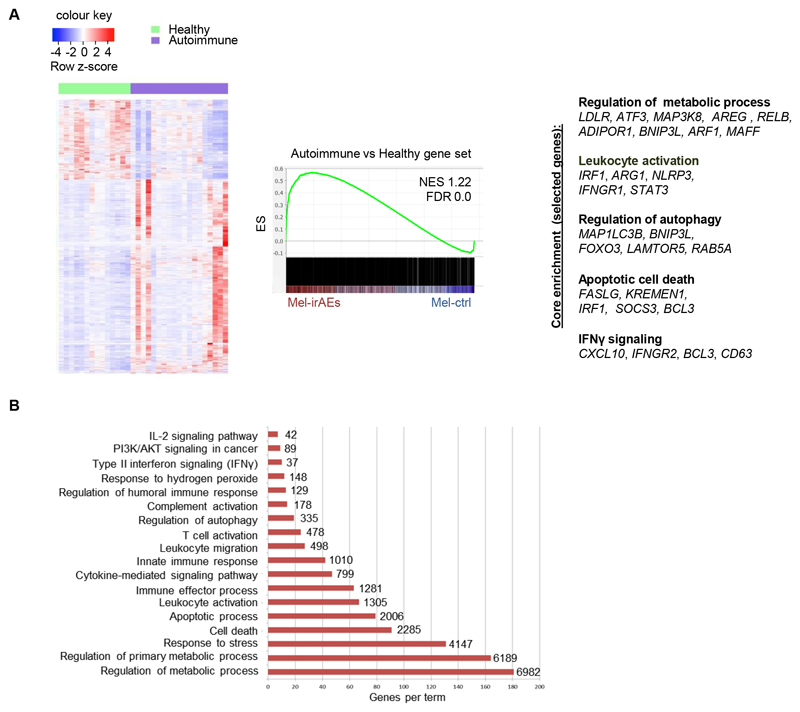
Figure 2. Inflammatory Treg transcriptomic profile: A common denominator of autoimmune diseases and irAEs.
(A) Heatmap of DEGs, with scaled cpm expression values (row z-score), from peripheral blood CD4+CD25+CD127–Tregs isolated from ‘Healthy (n=14) vs Autoimmune (n=20)’ individuals (left) and GSEA plot (right) showing the enrichment of ‘Mel-irAEs vs Mel-ctrl’ with the ‘Autoimmune vs Healthy’ gene set (NES 1.22, FDR 0.0). Selected core enriched genes listed to the bottom of the plot. (B) Bar plot representing pathway analysis of the core enriched genes deriving from comparison in panel A, with adjusted p value ≤ 0.05. Each term size is listed on the end of each bar. For DEG analysis, the GLM statistical approach and the thresholds: |FC|≥1.5 and p<0.05 were used.

