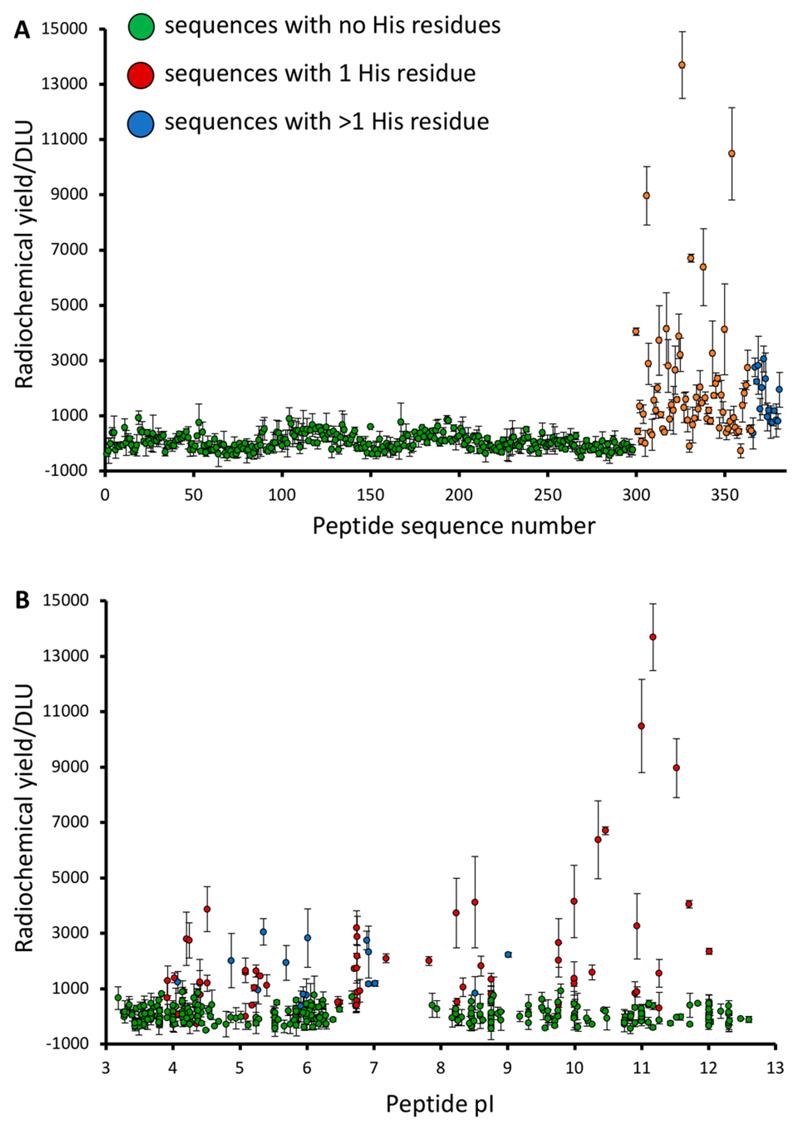
Figure 1. Initial observations from the STKS-1 array.
(A) Relative [99mTc][Tc(CO)3]+ labeling efficiency (DLU) of peptide sequences, categorized according to the number of His residues in the sequence; (B) Relationship between [99mTc][Tc(CO)3] + labeling efficiency and isoelectric point. GREEN = no His residues; RED = 1 His residue; BLUE = 2 or more His residues.

