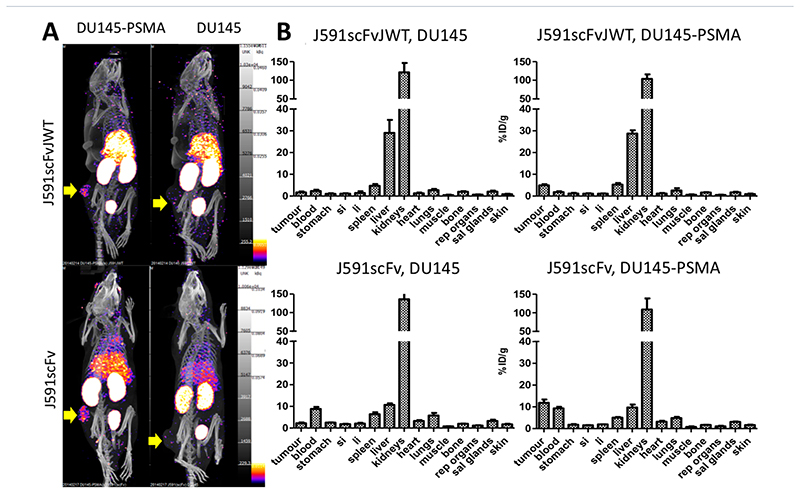
Figure 10. In vivo biodistribution and tumor targeting of [99mTc][Tc(CO)3]+-J591scFvJWT and [99mTc][Tc(CO)3]+-J591scFv’ showing specific uptake in PSMA-expressing tumor.
A. Example SPECT-CT images (75–90 min post-injection). B. Ex vivo biodistribution (90 min post-injection) of mice bearing DU145 tumor (non-PSMA expressing, indicated by yellow arrows, right images) and DU145-PSMA tumor (PSMA expressing, indicated by yellow arrows, left images) after administration of [99mTc][Tc(CO)3]+-J591scFvJWT (top images) or [99mTc][Tc(CO)3]+-J591scFv (bottom images). si = small intestine; li = large intestine; rep = reproductive; sal = salivary. Error bars represent standard deviation, n = 4 per group.

