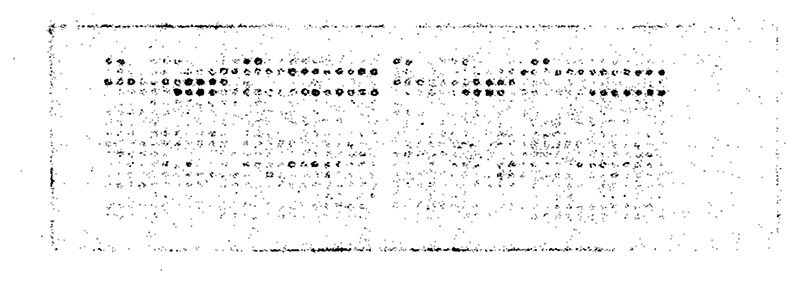
Figure 2. Typical digital autoradiograph of the His-tag array after incubation with [99mTc][Tc(CO)3]+ in phosphate buffer for 15 min.
Images obtained after 30, 60, and 120 min incubation are shown in SI Figure S2. The layout of amino acid sequences in the array can be seen in SI Tables S3–S4.

