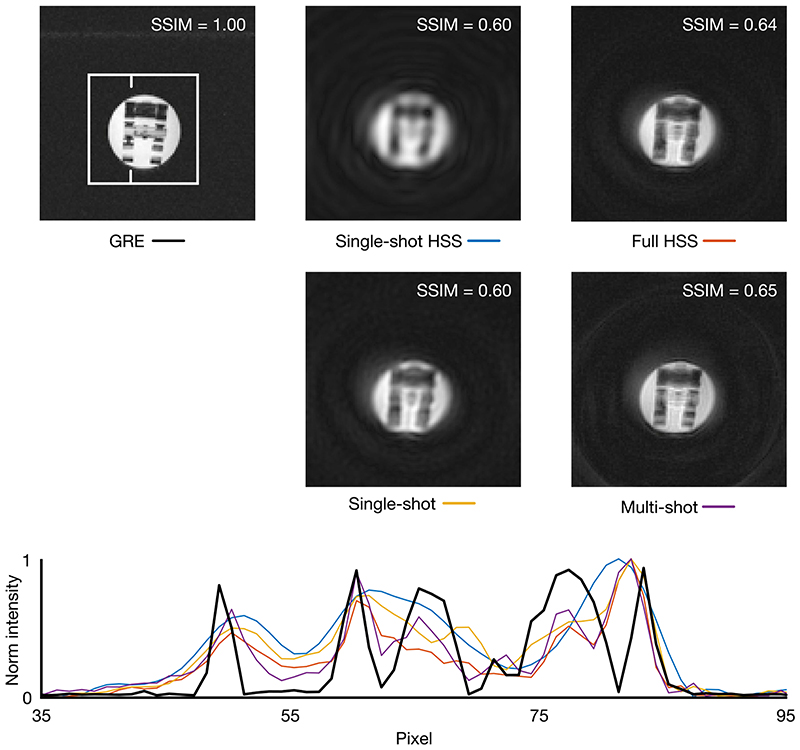
Figure 4.
Top: Reconstructed images of a resolution phantom ( = 12 ms) with structural similarity index, over the area in the white box, with the gradient echo (GRE) acquisition shown as reference, in the top right of each image. Bottom: Normalized line plot through each of the reconstructed images. The position of the line is denoted by the white notches in the gradient echo image

