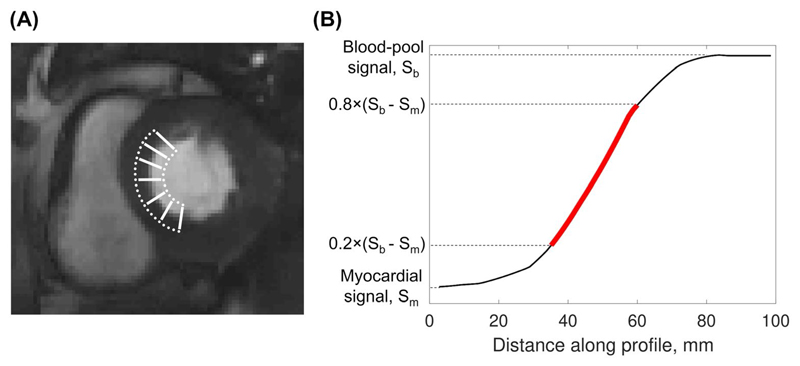
Figure 2. Illustration of sharpness measurements in vivo.
A, Typical locations of line profiles drawn across the septal blood-myocardium boundary. B, Red line represents the slope between 20% and 80% of the difference between myocardial and peak blood-pool signal intensity (Sb-Sm). The sharpness index is calculated as 1/d, where d is the distance over which the signal-intensity profile increases from 20% to 80% of the signal range

