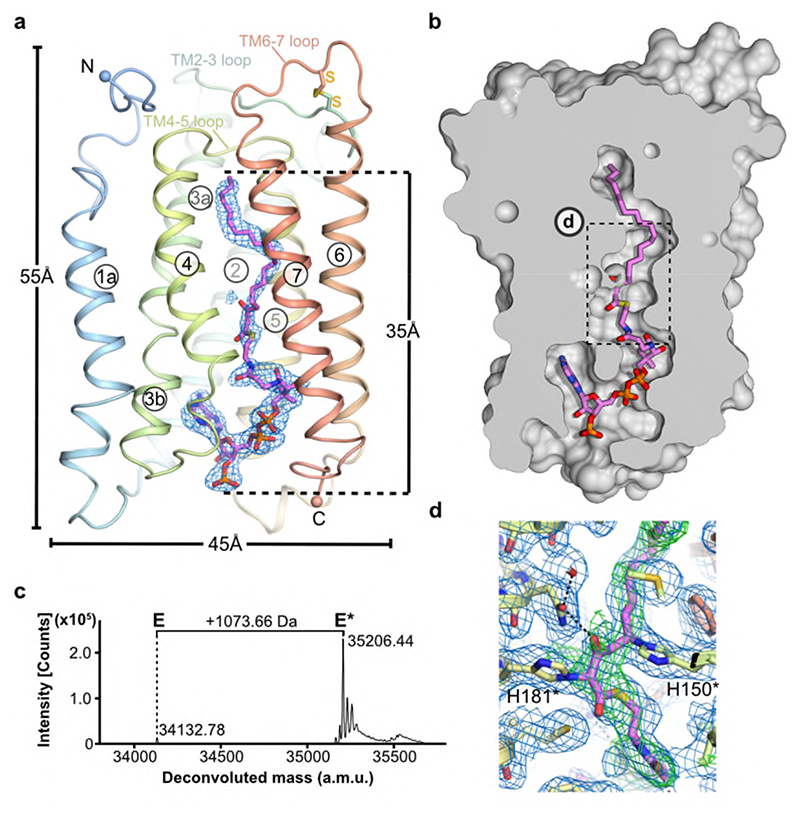
Fig. 2. Heterologously expressed ELOVL7 is covalently bound to a 3-keto acyl-CoA.
a, Cartoon showing the covalently bound 3-keto eicosanoyl-CoA along with the FoFc omit electron density map (blue mesh, contoured at 3σ). b, Cutaway molecular surface representation showing the extent of the enclosed central active site tunnel. c, Intact mass analysis of Sf9 purified protein (E) highlighting adduct species (E*; +1073.66Da). Data shown from one experiment. Similar adduct peaks were observed for all purifications tested (n=3). d, Electron density in region around covalent linkages to active site histidines. Final BUSTER 2mFo-DFc (blue mesh, contoured at 1sigma) and omit mFo-DFc (green mesh, contoured at 2.5sigma) electron density maps are overlaid on the final model.

