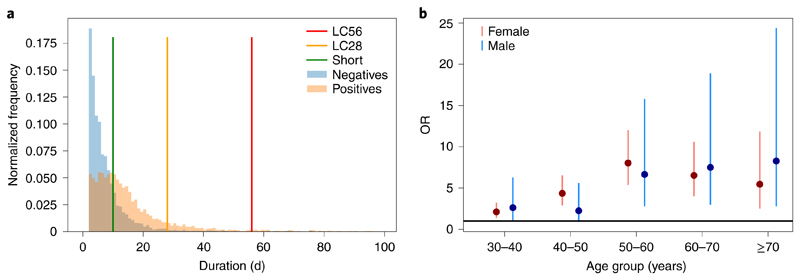
Fig. 1. Distribution of disease duration and age effect on duration.
a, Distribution of symptom duration in COVID-19. The colored bars indicate the limits to define short, LC28 and LC56 disease duration. The y axis represents the normalized frequency of symptom duration; 2.4% of negative controls and 3.3% of individuals with COVID-19 reported symptoms for ≥28d. b, ORs and 95% CIs of LC28 for each age decile compared to the 20- to 30-year-old age group when considering LC28 versus short COVID (1,516 females and 633 males). For males aged 20-30 years (n = 117), the proportion who had LC28 was 4.5%, compared with 5.6% of females in same age range (n = 357).

