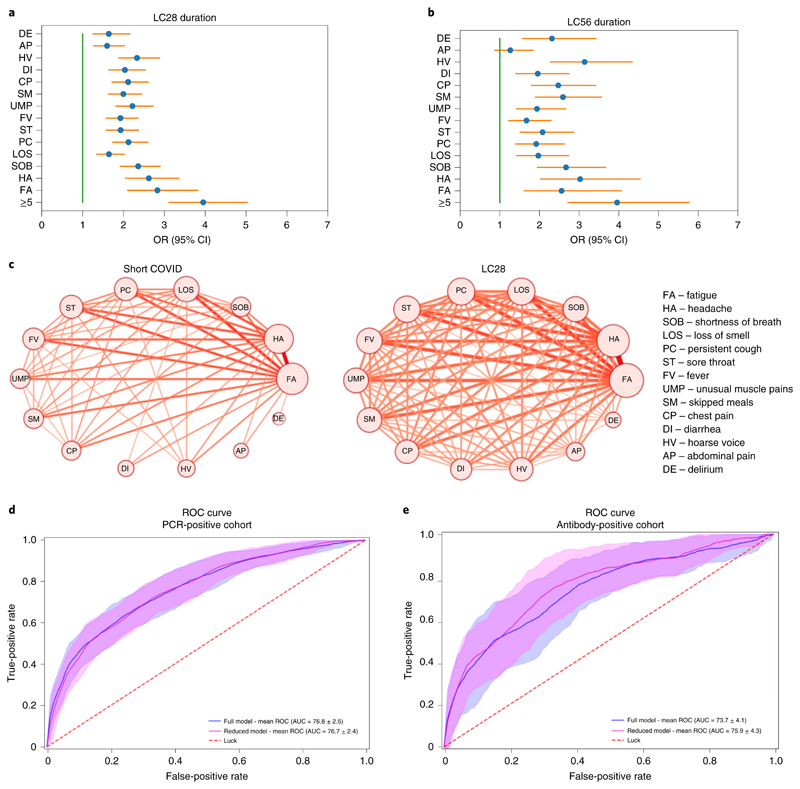
Fig. 3. Prediction of long COVID compared with short COVID and illustration of multi-system presentation.
a,b, Symptom correlates of long COVID for LC28 (n = 558; a) and LC56 (n = 189; b) compared to short COVID (n = 1,591) with correction for age and sex. Error bars indicate the 95% CI for the ORs. c, Co-occurrence network of symptom pairs in which nodes represent symptoms, the frequency of symptoms corresponds to the size of the node, and the likelihood of symptom pair co-occurrence is represented by the weight of the edges linking them. Edges representing a co-occurrence of less than 10% were removed. d, ROC curve of the cross-validated full and reduced models on the PCR cohort. e, ROC curve when training on the whole PCR cohort of short and LC28 (n = 2,149) and testing on the antibody-positive cohort (n = 1,440 short COVID and n = 165 LC28) for the full (blue) and reduced (magenta) models. Random predictive probability is indicated by the dashed red line.

