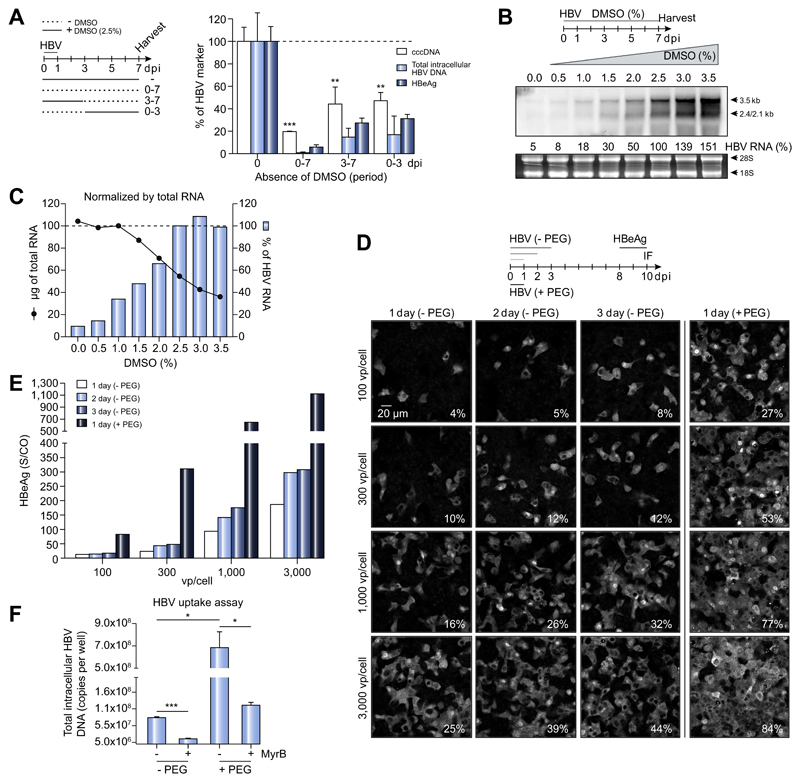
Fig. 1. Role of DMSO and PEG in HepG2-NTCP infection model.
(A) HepG2-NTCP-K7 cells were infected with HBV and maintained with or without 2.5% DMSO from the time of infection as indicated. Viral DNA and HBeAg levels were measured by qPCR and ELISA, respectively. (B) Cells were cultured with increasing concentrations of DMSO (up to 3.5%) one day after HBV infection. Total RNA was extracted at 7 dpi and subjected to Northern blot analysis using an HBV-DNA probe. Viral RNA was quantified with 2.5% DMSO condition set to 100%. Ribosomal RNA (28S and 18S) stained by ethidium bromide is shown as a loading control. (C) The amount of total RNA from a 35 mm dish extracted at respective conditions (black line with solid circle) and the relative amount of HBV-RNA normalized to total RNA (blue bar) are given. (D, E) HepG2-NTCP-K7 cells were infected with either increasing moi (100, 300, 1,000, and 3,000 vp/cell) of HBV in the absence of PEG or at an moi of 100 vp/cell in the presence of PEG for 1, 2 and 3 days as indicated. (D) Cells were fixed and stained for HBV core protein and the percentage of infected cells is denoted at the bottom-right corner of each image. (E) HBeAg was determined in extracellular media. (F) HBV uptake was determined with or without PEG in the presence or absence of the entry inhibitor MyrB. HBV genomes inside the cells were quantified by qPCR. Statistical significance was determined using Student’s t test (*p <0.05, **p <0.01, ***p <0.001). dpi, day post-infection; HBeAg, HBV e antigen; HBV, hepatitis B virus; moi, multiplicity of infection; MyrB, Myrcludex-B; PEG, polyethylene glycol; qPCR, real-time PCR; vp, virus particle.

