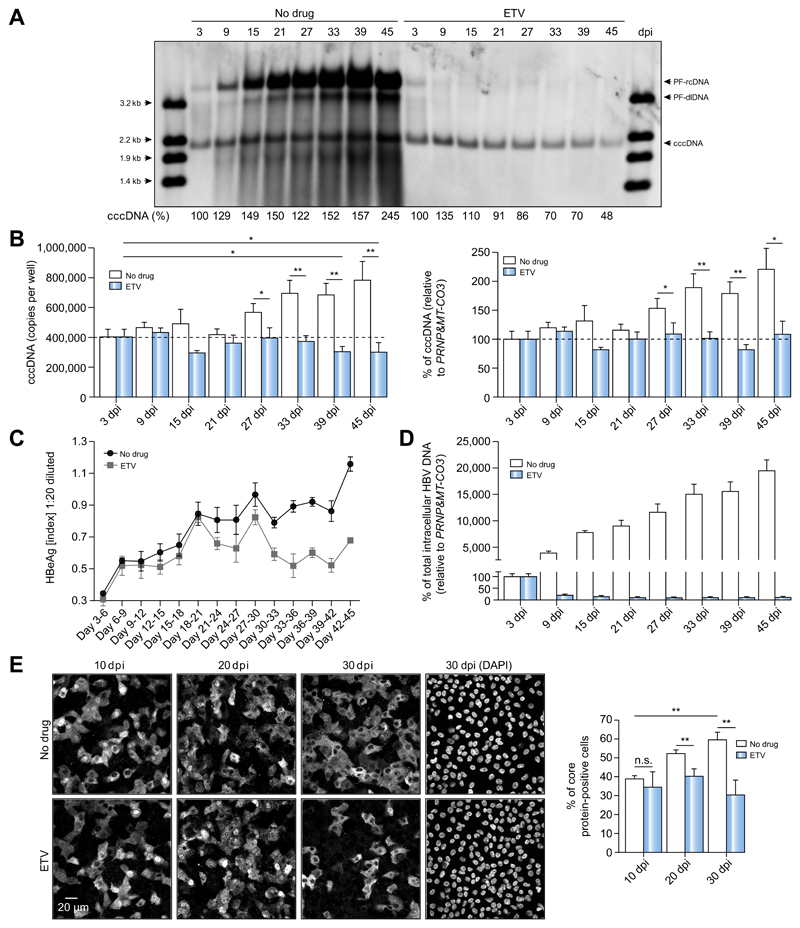
Fig. 3. Dynamics of cccDNA during long-term culture of HBV-infected HepG2-NTCP-K7 cells.
(A-D) HepG2-NTCP-K7 cells were infected with HBV at an moi of 300 vp/cell (A) or 100 vp/cell (B-D) and kept with or without ETV (1 lM) treatment from 3 dpi onwards. (A) DNA was isolated after Hirt extraction at different time points and subjected to Southern blot analysis using an HBV-DNA probe. Restriction fragments of HBV-DNA (3.2 kb to 1.4 kb) in the first and last lanes serve as size markers and as controls for Southern blot transfer efficiency. Percentage values below each lane indicate the relative amount of cccDNA. (B-D) cccDNA and total intracellular HBV-DNA, and HBeAg levels were measured by qPCR and ELISA, respectively. For cccDNA measurement, both absolute copy numbers and relative cccDNA values to PRNP and MT-CO3 are given. (E) Cells were infected with HBV at an moi of 300 vp/cell and treated with ETV from 3 dpi. Intracellular HBV core protein was visualized by immunofluorescence staining at 10, 20, and 30 dpi. The number of core protein-positive cells at each time point was counted and is plotted in a bar graph. Statistical significance was determined using Student’s t test (**p <0.01). cccDNA, covalently closed circular DNA; dpi, day post-infection; ETV, entecavir; HBeAg, HBV e antigen; HBV, hepatitis B virus; moi, multiplicity of infection; qPCR, real-time PCR; vp, virus particle.

