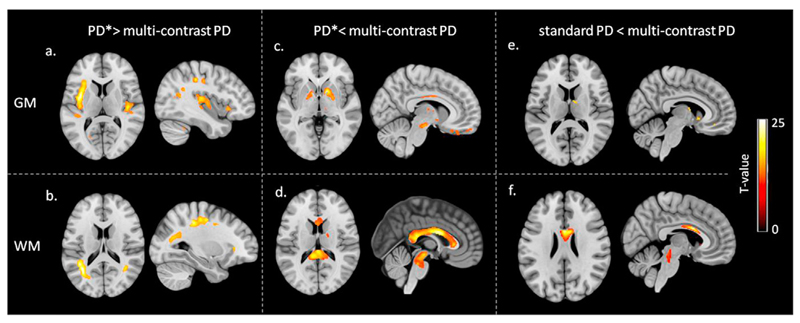
Fig. 5.
Voxel-wise comparison of effective in-vivo proton density (PD*) with multicontrast PD maps, and between standard PD and multi-contrast PD maps in grey matter (GM) and white matter (WM). The statistical maps of paired t-test at statistical threshold of pFWE < 0.05 are displayed on T1w image in standard MNI space. (a) Higher PD* values compared to multicontrast PD in GM. (b) Higher PD* values compared to multi-contrast PD in WM. (c) Higher multi-contrast PD values compared to PD* in GM. (d) Higher multi-contrast PD values compared to PD* in WM. (e) Higher multi-contrast PD values compared to standard PD in GM. (f) Higher multi-contrast PD values compared to standard PD in WM.

