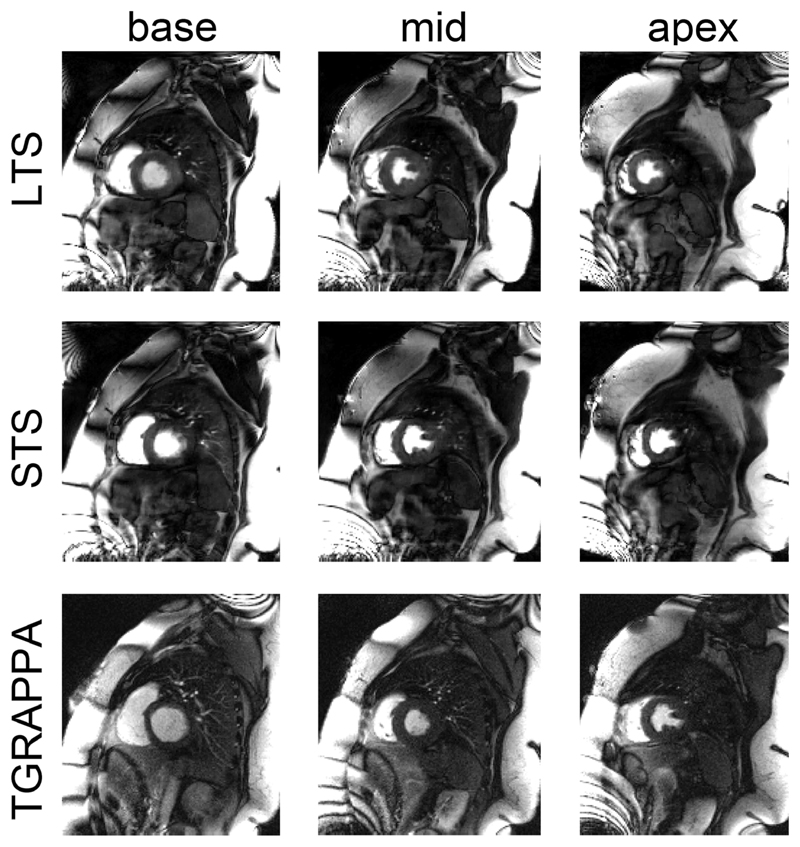
Figure 5.
Data from 1 large patient. Reconstruction of the entire FOV of base (left), mid-, (middle), and apical (right) slices. Top and middle rows report LTS and STS data from the SMS3 CS acquisition, whereas the bottom row shows the TGRAPPA sequence. All data are shown at peak blood signal enhancement in the left ventricle. LTS, long saturation time; SMS, simultaneous multi-slice; STS, short saturation time; TGRAPPA, temporal GRAPPA

