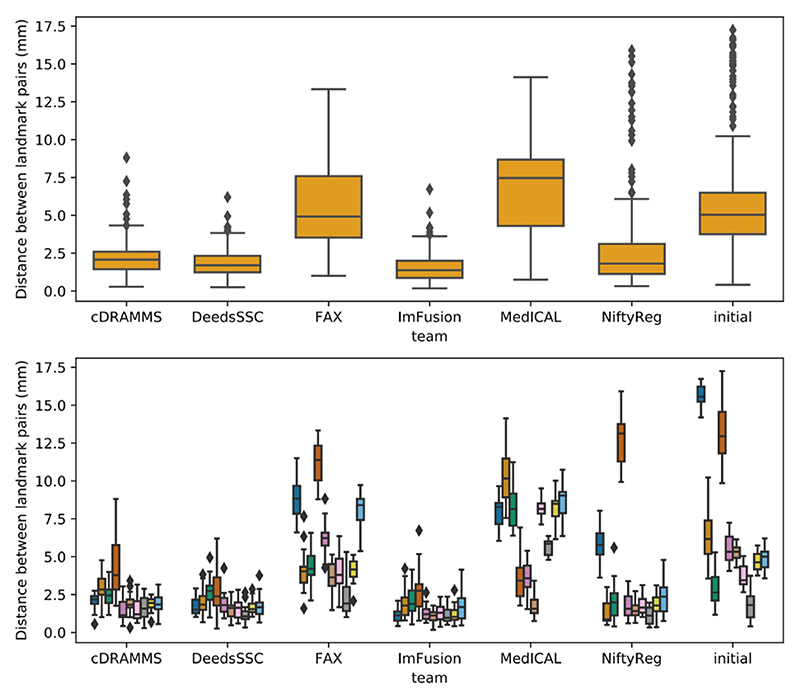
Fig. 3.
Distribution of the distances between landmark pairs obtained by each team after registration, on the test set. For comparison, the last column contains the initial distances before registration. The upper panel shows the global results computed over all landmarks of all test cases. in the lower panel, these results are split by test case.

