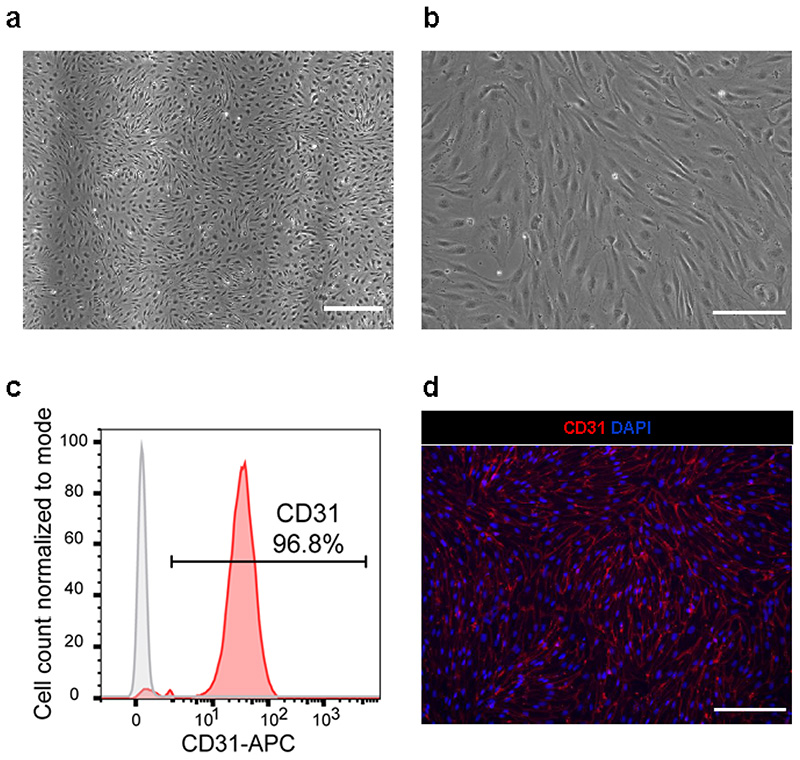
Fig. 4. hiPSC-EC characterization.
(a) Representative brightfield image of CD34+ hiPSC-ECs 6 d postisolation and before freezing. Scale bar, 200 μm. (b) Representative brightfield image of CD34+ hiPSC-ECs after thawing at higher magnification. Scale bar, 200 μm. (c) Flow cytometry analysis of CD34+ hiPSC-ECs showing a representative histogram for the expression of the EC marker CD31. Isotype negative control (grey) and hiPSC-ECs are stained with CD31 (red). (d) Representative immunofluorescence images of the endothelial marker CD31 in hiPSC-ECs (day 12). Nuclei are stained with DAPI (blue). Scale bar, 50 μm.

