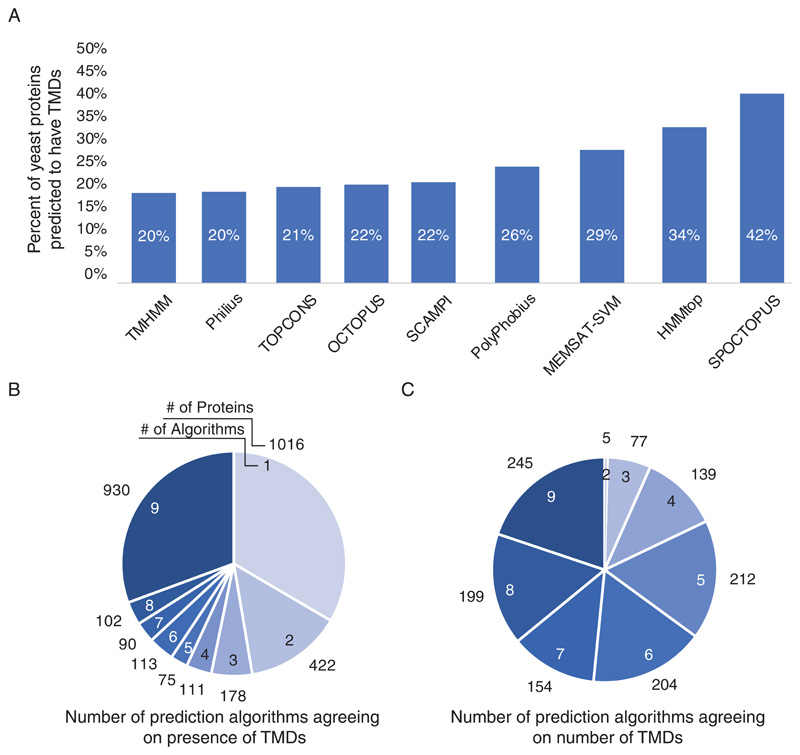
Figure 1. Comparison of the predictions from various algorithms on transmembrane domain presence and number.
(A) Bar graph showing the percent of proteins in the yeast genome predicted to be membrane spanning according to each of the prediction algorithms. (B) Pie chart showing the relative portion of prediction algorithms agreeing on presence of TMDs. Numbers inside pie chart represent the number of prediction programs that are in agreement. The numbers outside the pie chart represent the number of proteins falling into each category N=3037 (C) Pie chart showing the relative portion of prediction algorithms agreeing on the number of TMDs only in those proteins that were predicted to have more than one TMD by at least five programs. Numbers inside pie chart represent the number of prediction programs that are in agreement. The numbers outside the pie chart represent the number of proteins falling into each category N=1235

