FIGURE 5.

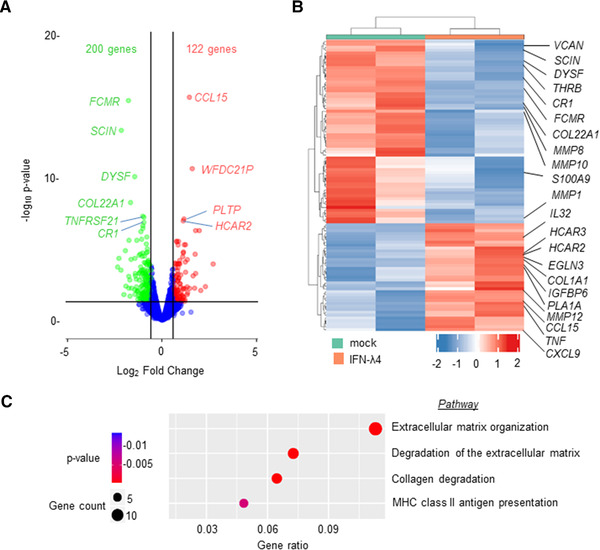
RNA‐sequencing (RNA‐seq) analysis shows that IFN‐λ4 confers a modified M1 phenotype on monocyte‐derived macrophages (MDMs). MDMs differentiated from CD14+ monocytes (as shown in Fig. 4A) from a single donor were subjected to paired‐end RNA‐seq analysis. Duplicate samples that had mock or IFN‐λ4 treatment during differentiation with GM‐CSF were used. (A) Volcano plot showing the differentially expressed genes (DEGs) in IFN‐λ4‐treated MDMs compared with untreated cells; a cut‐off of 1.5‐fold change and P = 0.05 were used. (B) Heatmap of the top 100 up‐ and down‐regulated DEGs are shown, with duplicate IFN‐λ4‐treated and mock‐treated samples in different colors. Some of the important genes are shown on the right (also included in Table 1). (C) Reactome pathway enrichment analysis bubble plot of the DEGs (IFN‐λ4 vs. mock) showing the top four most affected pathways
