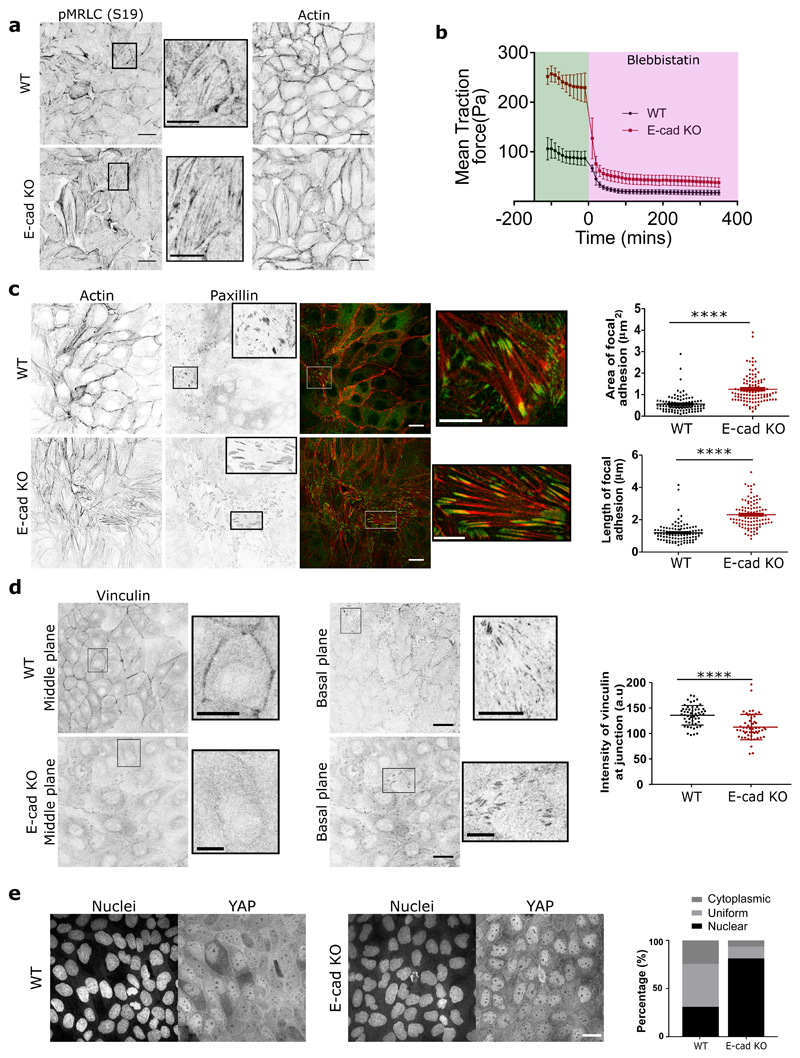
Figure 4. E-cadherin removal triggers mechanotransductive changes within the monolayer.
a) pMRLC (left), zoom of pMRLC (middle), actin (right) staining of MDCK WT (top) and E-cadherin KO (bottom) monolayers. b) Evolution of mean traction force of MDCK WT and E-cadherin KO monolayers before and after 20μM blebbistatin treatment (n=10 from 2 independent experiments). c, d, e) actin (red) and paxillin (green) (c), vinculin (d), YAP (green), and nucleus (blue) (e), staining within a monolayer for both MDCK WT and E-cadherin KO cells. c) Area of focal adhesion (left) and length of focal adhesion within the monolayer for n=106 focal adhesions. d) Mean intensity of vinculin at the cell-cell junction in the middle plane (n=54). e) Distribution of YAP in nucleus, cytoplasm, or uniform distribution calculated for n=1162 cells (MDCK WT) and n=1008 cells (MDCK E-cadherin KO). Error bars represent the standard deviation. Unpaired t-test was performed leading to *p<0.05, **p<0.01, ***p<0.001 and ****p<0.0001. Scale bars, 20μm and 10μm for the figure zooms.

