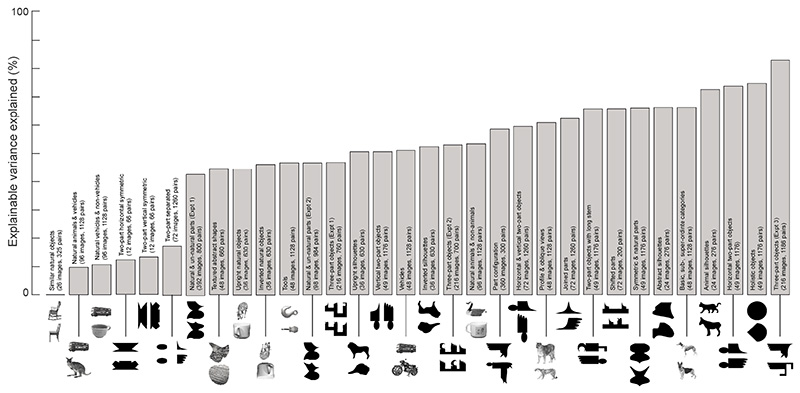
Fig. 3. Generalization of the best model to novel experiments.
Each bar represents the amount of variance explained by the best model (comb2) when it was trained on all other experiments and tested on that particular experiment. The text inside each bar summarizes the images and image pairs used, and the image centered below each bar depicts two example images from each experiment.

