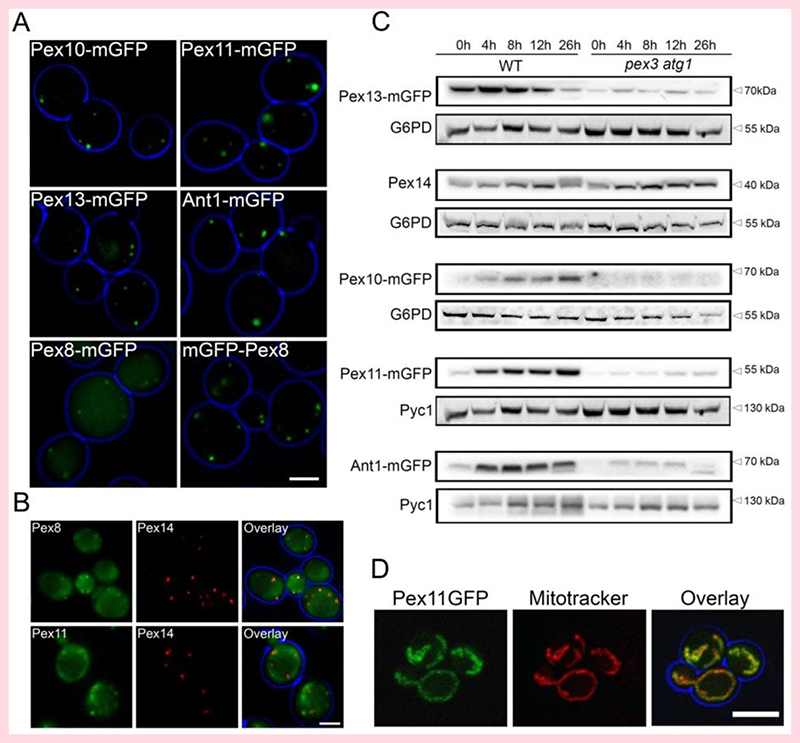
Figure 3. PMPs levels and localization in WT and pex3 atg1 cells.
FM analysis of glucose-grown WT (A) or pex3 atg1 cells (B) producing various C-terminal GFP-tagged PMPs under control of their endogenous promoters. mGFP-Pex8 was produced under control of PNOP1. The pex3 atg1 cells (B) also produce Pex14-mCherry to mark the peroxisomal vesicles. (C) Western blot analysis of the indicated GFP fusion proteins (produced under control of their endogenous promoters) in whole cell lysates of WT and pex3 atg1 cells. Cells were pre-cultivated in minimal media containing glucose, subsequently shifted to media containing a mixture of glucose and oleic acid. Samples were taken at the indicated time points after the shift. Pyc1 or G6PD were used as loading controls. (D) Confocal laser scanning microscopy analysis of pex3 atg1 cells producing Pex11-mGFP under control of the PPEX11. Mitochondria were stained with Mitotracker (Red). Living cells growing on glucose medium containing 1% agar were imaged. Scale bars: 2.5 μm (A), 5 μm (B, D).

