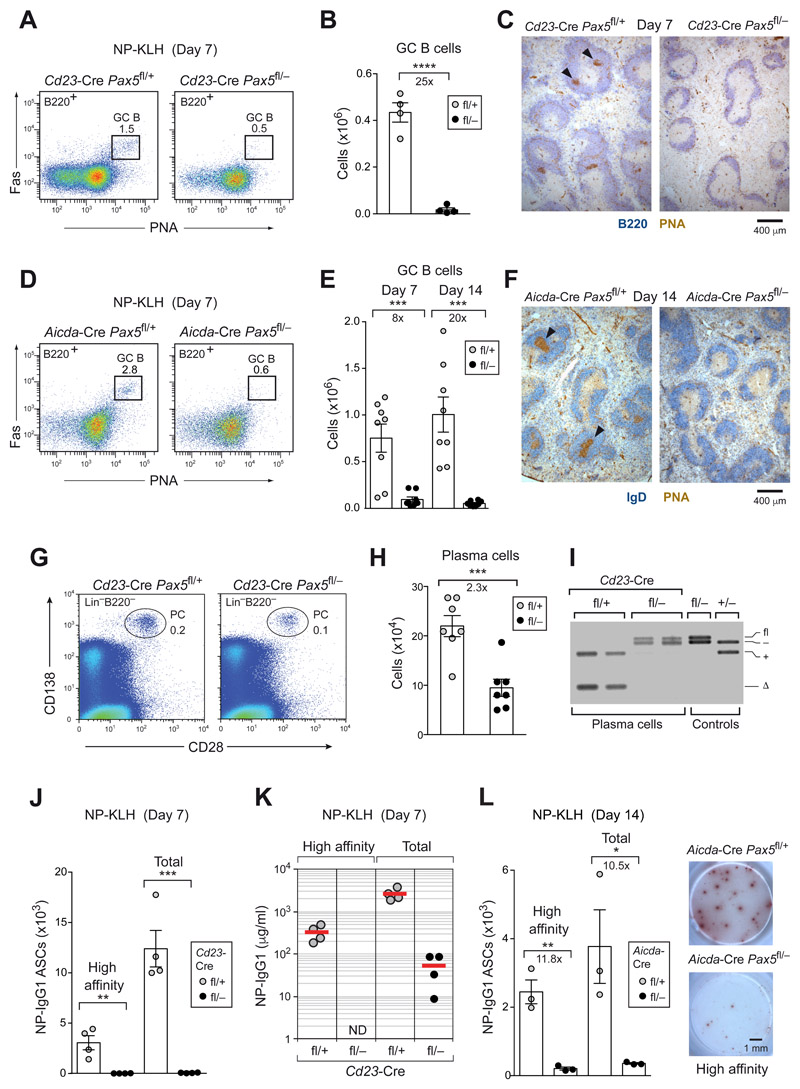
Figure 2. The initiation and maintenance of GC B cell differentiation depended on Pax5.
(A-C) GC B cell differentiation in the spleen of Cd23-Cre Pax5 fl/+ (fl/+; gray dots) and Cd23-Cre Pax5 fl/− (fl/–; black dots) mice at day 7 after immunization with NP-KLH (in alum). Absolute numbers of GC B cells (B220+Fas+PNA+) were determined by flow cytometry (A,B), and PNA+ GC B cells were visualized by staining of spleen sections for PNA (brown) and B220 (blue) expression (C). Arrowheads indicate GCs. (D-F) GC B cell differentiation in the spleen of Aicda-Cre Pax5 fl/+ and Aicda-Cre Pax5 fl/− mice at day 7 and 14 after immunization with NP-KLH (in alum) was analyzed, as described above. (G-I) Flow-cytometric analysis of plasma cells (CD28+CD138+Lin−) from the bone marrow (femur and tibia of hind legs) of non-immunized Cd23-Cre Pax5 fl/+ and Cd23-Cre Pax5 fl/− mice (G,H). PCR determination of Pax5 exon 2 deletion in sorted plasma cells (I), as described in Fig. 1G. (J-L) T cell-dependent immune responses. Pax5 fl/+ and Pax5 fl/− mice carrying Cd23-Cre (J) or Aicda-Cre (L) were immunized with NP-KLH (in alum) and analyzed at the indicated days after immunization by ELISPOT assay to determine NP-specific IgG1 antibody-secreting cells (ASCs) in the spleen. NP4-BSA- or NP23-BSA-coated plates were used for detecting ASCs secreting high-affinity or total anti-NP-IgG1 antibodies, respectively. Representative ELISPOT images are shown. (K) ELISA analysis of serum titers of NP-specific IgG1 antibodies using NP7-BSA- or NP30-BSA-coated plates. ND, not detected. Statistical data (B,E,H,J,L) are shown as mean value with SEM and were analyzed by the two-tailed unpaired Student’s t-test; *P < 0.05; ***P < 0.001 and ****P < 0.0001. Each dot represents one mouse.

