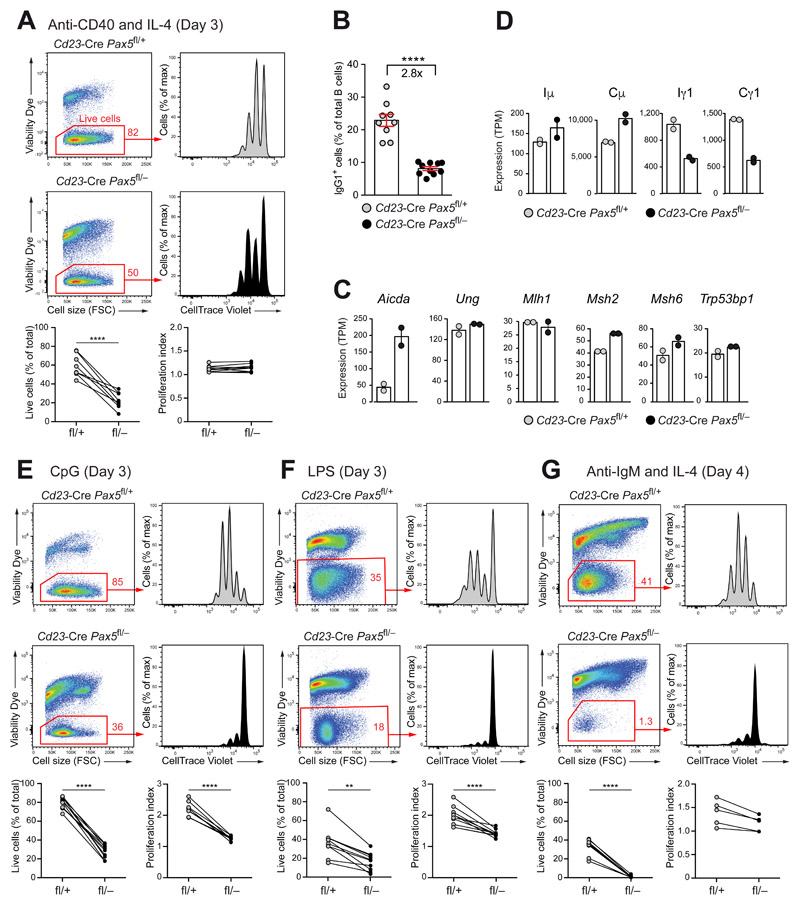
Figure 3. Pax5 controlled B cell proliferation in response to BCR and TLR signaling.
(A,B) Proliferation and IgG1 CSR response to anti-CD40 plus IL-4 stimulation. CellTrace Violet-labeled FO B cells from lymph nodes of Cd23-Cre Pax5 fl/− (fl/–; black) and Cd23-Cre Pax5 fl/+ (fl/+; gray) mice were stimulated with anti-CD40 and IL-4 for 3 (A) or 4 (B) days and then stained with the Viability Dye eFluor™ 780. The cell viability and proliferation index of the stimulated cells (A) and the percentage of IgG1+ B cells (B) were determined by flow-cytometric analysis. Lines connect the results obtained with Pax5-deficient and control B cells in the same stimulation experiment. (C,D) Gene expression in lymph node B cells stimulated with anti-CD40 and IL-4 for 2 days, as determined by RNA-seq (Fig. S3E). The expression of selected genes involved in CSR (C) and the abundance of germline transcripts at the Iμ and Ig1 exons and transcripts at the Cμ and Cg1 exons (D) are shown as mean expression value (TPM, transcripts per million) with SEM based on two independent RNA-seq experiments per genotype. (E-G) Stimulation of lymph node FO B cells of the indicated genotypes with CpG oligodeoxynucleotides (E) and LPS (F) for 3 days or with anti-IgM and IL-4 (G) for 4 days, as described (A). The data (A,E,F,G) were statistically analyzed by the two-tailed unpaired Student’s test: **P < 0.01, ****P < 0.0001. Each dot represents one mouse.

