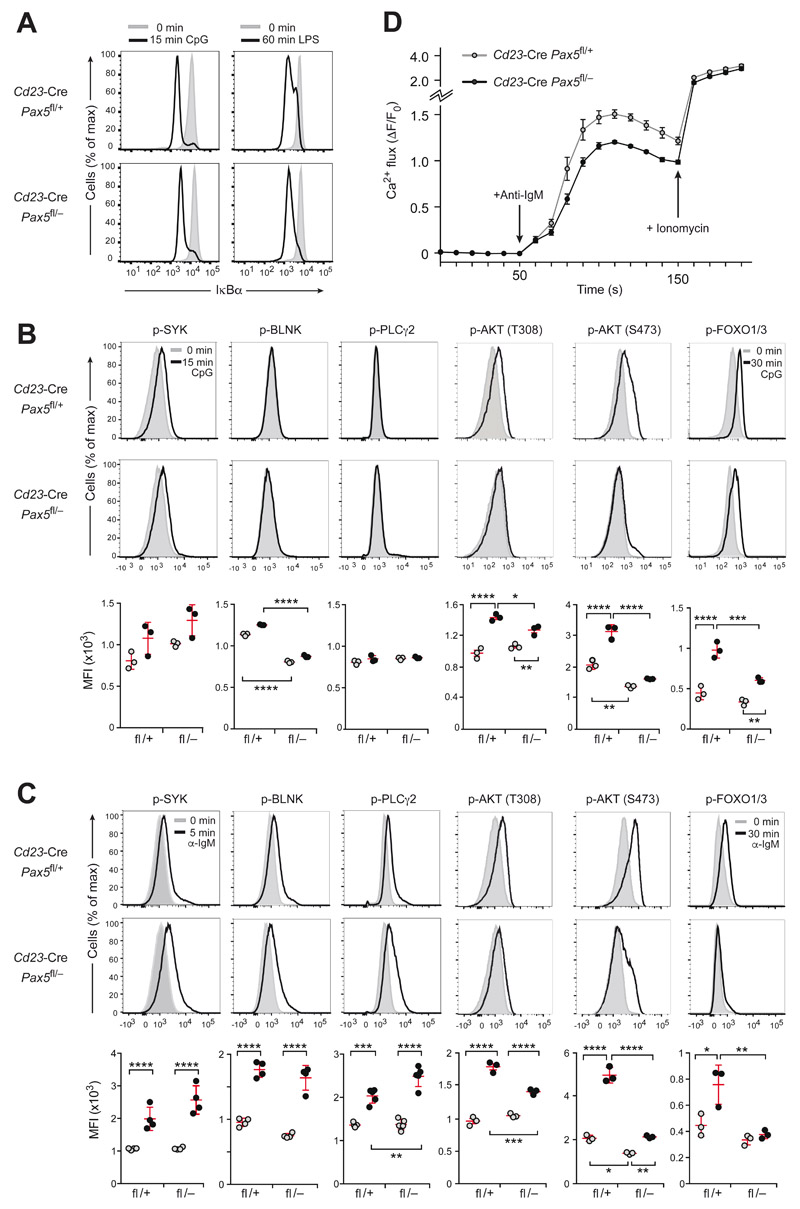
Figure 4. Intracellular signaling upon TLR9 and BCR activation in Pax5-deficient FO B cells.
(A) IκBα degradation upon TLR signaling. The IkBa protein amount was determined by intracellular staining of CD43− FO B cells from lymph nodes of Cd23-Cre Pax5 fl/− or control Cd23-Cre Pax5 fl/+ mice before (gray surface) and after (black line) stimulation for 15 min with CpG oligodeoxynucleotides or for 60 min with LPS. (B,C) Intracellular TLR9 and BCR signaling. The phosphorylation (p-) status of signal transducers of the calcium and PI3K signaling pathways (Fig. S4A) was determined in lymph node FO B cells of the indicated genotypes before or after stimulation with CpG oligodeoxynucleotides for 15 min (B) or stimulation with anti-IgM for 5 min (C) except for a 30-min stimulation with either stimuli for analyzing p-FOXO1,3. (B,C). Flow cytometry (top and middle) was performed with antibodies specific for p-AKT (p-Thr308) p-AKT (p-Ser473), p-BLNK (p-Tyr84), p-PLCγ2 (p-Tyr759), p-SYK (p-Tyr525/526) and p-FOXO1 (p-Thr24)/p-FOXO3 (p-Thr32). Bottom, the median fluorescence intensity (MFI) for untreated (gray dots) and stimulated (black dots) FO B cells of the indicated genotypes is shown. Statistical data are indicated as mean value with SEM and were analyzed by two-way ANOVA with Tukey’s multiple comparison test; *P < 0.05, **P < 0.01, ***P < 0.001, ****P < 0.0001. Each dot represents one mouse. One of at least three experiments is shown. (D) Calcium mobilization in response to BCR signaling. Intracellular Ca2+ fluxes in CD43− FO B cells from lymph nodes of the indicated genotypes were recorded as an increase of the fluorescent emission of a Ca2+ sensor dye after addition of anti-IgM (arrow, after 50 s) or ionomycin (arrow, after 150 s) and are presented as ΔF/F0 (F0, average fluorescence before antibody addition; ΔF, fluorescence at time ‘t’ - F0). Mean values with SEM are shown for 3 independent experiments.

