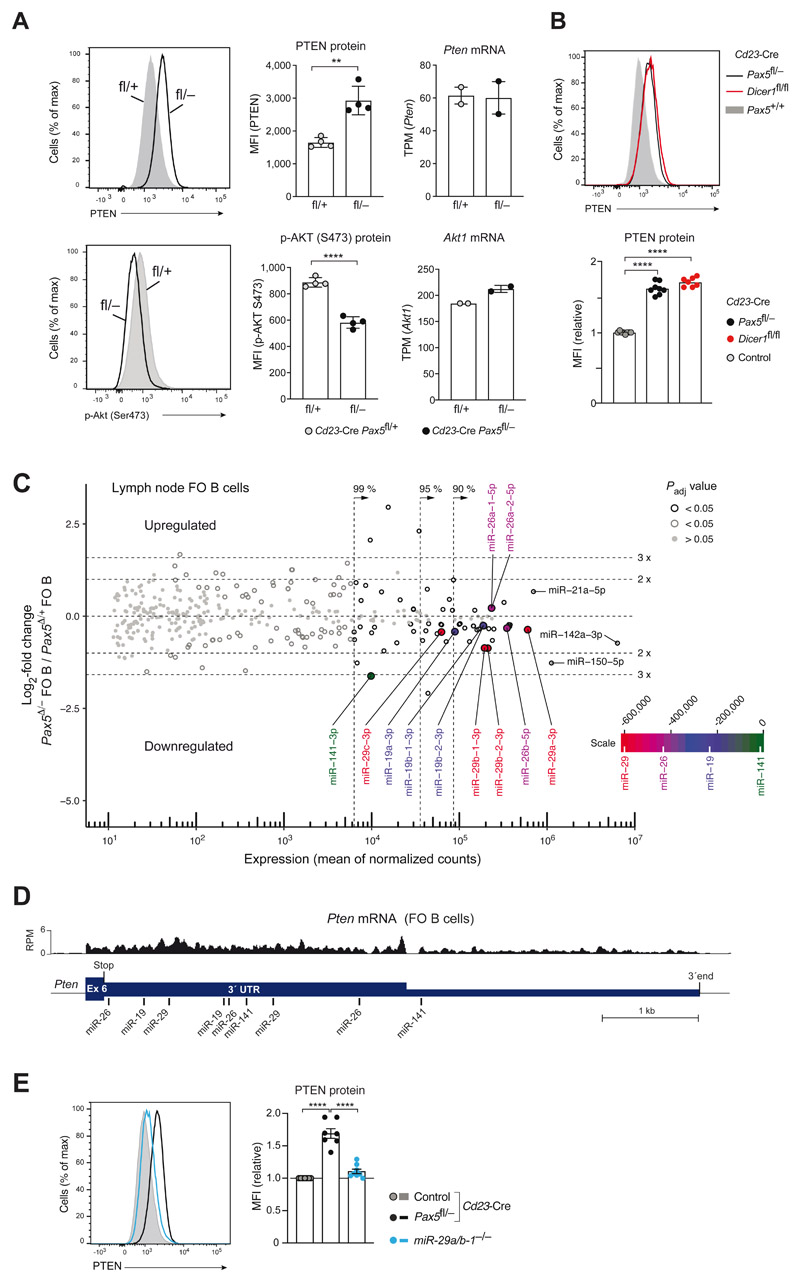
Figure 6. Pax5 downregulated PTEN expression by controlling the abundance of Pten-targeting microRNAs.
(A) PTEN protein expression and phosphorylation of AKT (Ser473) in unstimulated lymph node FO B cells of Cd23-Cre Pax5 fl/− (back) and Cd23-Cre Pax5 fl/+ (gray) mice, as determined by intracellular staining (left) and MFI quantification (middle). Pten and Akt1 mRNA expression in the same FO B cell types (right) is shown as mean expression value (TPM) with SEM, as determined by RNA-seq. (B) PTEN expression in lymph node FO B cells of Cd23-Cre Dicer1 fl/fl (red), Cd23-Cre Pax5 fl/− (black) and Cd23-Cre Pax5 +/+ (gray) mice, as determined by intracellular staining and quantification of the MFI values relative to the control genotypes (Cd23-Cre Pax5 +/+ Dicer1 +/+, Pax5+/+ Dicer1 +/+, Pax5 fl/+ Dicer1 +/+, Pax5 +/+ Dicer1 fl/+ or Pax5+/+ Dicer1 fl/fl). (C) MA plot of miRNA expression differences between Cd23-Cre Pax5 fl/− (Pax5 Δ/−) and Cd23-Cre Pax5 fl/+ (Pax5 Δ/+) FO B cells, which were isolated from lymph nodes as CD23+ cells by immunomagnetic sorting. Two small-RNA-seq experiments per genotype were performed. The abundance of individual miRNAs in the two B cell types is plotted as mean value of the normalized counts versus the log2-fold change in abundance between Pax5 Δ/− and Pax5 Δ/+ FO B cells (Table S4 and S6). Dotted lines indicate the area containing 99%, 95% or 90% of the total normalized counts. The statistical significance of the observed differences is indicated by gray and black circles (P value < 0.05) or gray dots (P value > 0.05). Adjusted P values were determined by DESeq2. Each symbol represents one miRNA species. Pten-targeting miRNAs are highlighted by the color corresponding to their position on the scale bar, which was generated by multiplying the sum of the normalized read counts of all members of a miRNA family with the total context+/+ score of the miRNA family (Table S5). (D) Location of the target sites of the indicated miRNAs in the 3’UTR of the mouse Pten mRNA, as predicted by the TargetScanMouse algorithm (v7.2; targetscan.org; (37)). The mRNA-seq profile of Pten exon 6 in control FO B cells is shown. (E) PTEN expression in unstimulated lymph node FO B cells of miR-29a/b-1 −/− (blue), Cd23-Cre Pax5 fl/− (back) and control Cd23-Cre Pax5 fl/+ (gray) mice, as determined by intracellular staining (left) and quantification of the MFI values (right) relative to control FO B cells (Cd23-Cre Pax5 +/+, Cd23-Cre Pax5 fl/+, Pax5 +/+ or Pax5 fl/fl). Statistical data (A,B,E) are shown as mean value with SEM and were statistically analyzed by the two-tailed unpaired Student’s t-test (A) or by one-way ANOVA with Tukey’s multiple comparison test (B,E): **P < 0.01, ****P < 0.0001.

