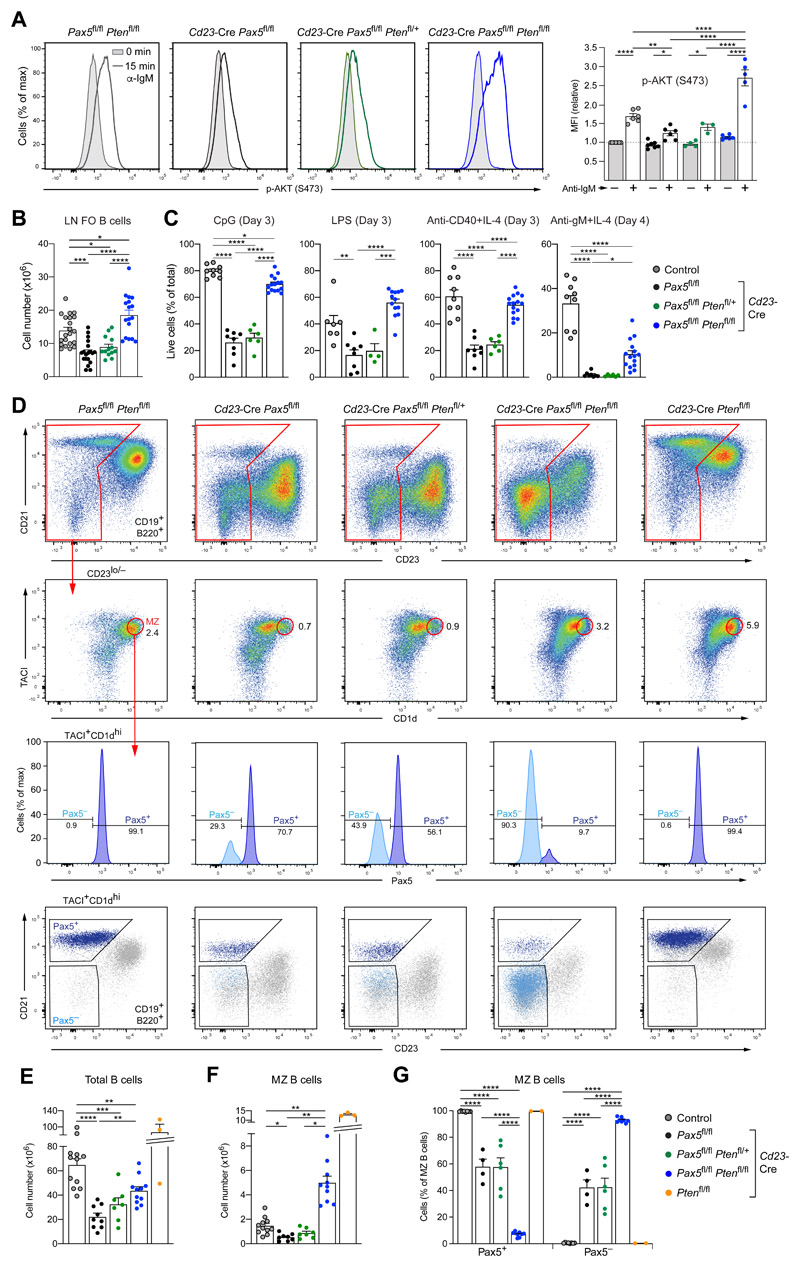
Figure 7. Loss of PTEN rescued PI3K signaling, FO B and MZ B cell numbers in Pax5 mutant mice.
(A) Rescue of PI3K signaling. CD43− FO B cells from lymph nodes of Cd23-Cre Pax5 fl/fl (black), Cd23-Cre Pax5 fl/fl Pten fl/+ (green), Cd23-Cre Pax5 fl/fl Pten fl/fl (blue) and control Pax5 fl/fl Pten fl/fl (gray) mice were either left untreated (gray surface) or stimulated (colored line) for 15 min with anti-IgM prior to intracellular staining with an anti p-AKT (Ser473) antibody (left). Quantification of the MFI values relative to the unstimulated FO B cells of the control genotype is shown to the right. (B,C) Rescue of the FO B cell survival before and after stimulation. FO B cells from lymph nodes (LN) of the indicated genotypes were analyzed directly ex vivo (B) or after stimulation (C) with CpG oligodeoxynucleotides, LPS, anti-CD40 and IL-4 or anti-IgM and IL-4 for the indicated days prior to staining with the Viability Dye eFluor™ 780. The frequency of viable B cells is plotted. (D) Flow-cytometric analysis of MZ B cells in the spleen of the indicated genotypes. MZ B cells were identified as CD19+B220+CD23lo/−TACI+CD1dhi cells and analyzed for Pax5 protein expression by intracellular staining. As shown by backgating, the Pax5+ MZ B cells expressed CD21, whereas the Pax5− MZ B cells lost CD21 expression. (E-G) Statistical analysis indicating the number of total B cells (E) and MZ B cells (F) as well as the relative frequency of Pax5+ and Pax5− MZ B cells (G) in the spleen of mice of the five indicated genotypes. Statistical data are shown as mean value with SEM and were analyzed by two-way ANOVA with Šídák’s multiple comparison test (A) or one-way (B,C,E,F) or two-way (G) ANOVA with Tukey’s multiple comparison test; *P < 0.05, **P < 0.01, ***P < 0.001, ****P < 0.0001. Each dot represents one mouse. The control genotypes (A,B,E,F,G) were Pax5 fl/fl Pten fl/fl, Pax5 fl/fl Pten fl/+, Pax5 fl/fl Pten +/+ or Cd23-Cre Pax5 fl/+ Pten +/+.

