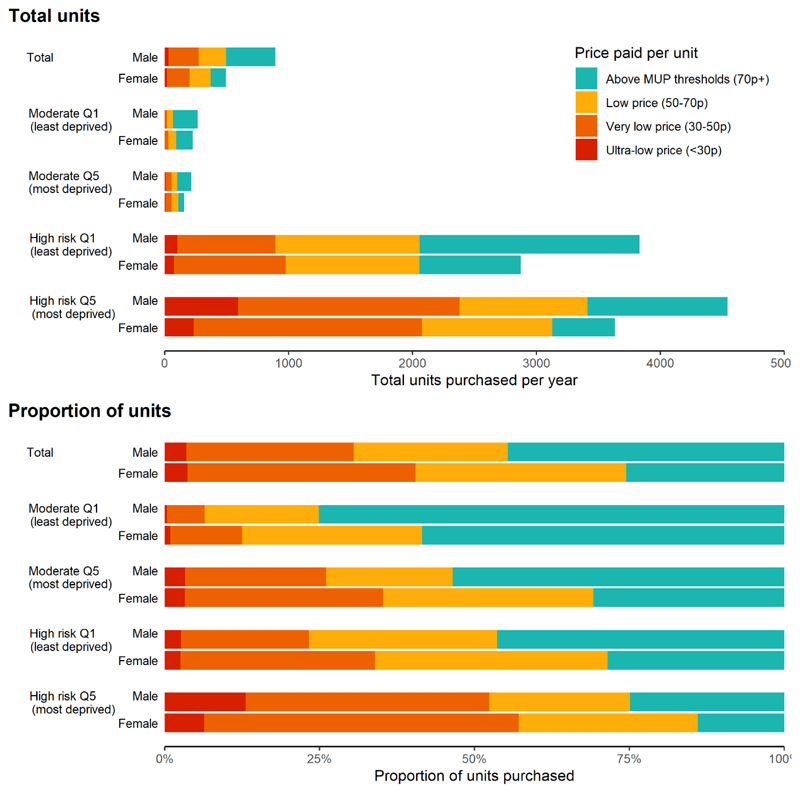
Figure 3.
Price distribution of alcohol purchases by gender, deprivation and drinker level, England 2016: top: total and bottom: relative distributions. Red and dark orange: units affected by MUP50. Red, dark and light orange: units affected by MUP70. Turquoise: units above minimum pricing thresholds.

