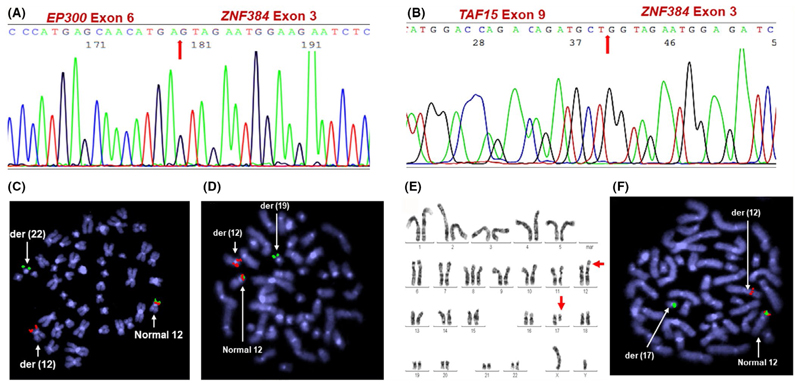
Figure 1. Identification of ZNF384 gene fusions.
Sequence of the (A) EP300-ZNF384 fusion involving exon 6 of EP300 and exon 3 of ZNF384 (UPN. No FS 84/19 ) (B) TAF15-ZNF384 fusion involving exon 9 of TAF15 and exon 3 of ZNF384 (UPN. No FS 39/19) (C-D) Inverted DAPI view of metaphase FISH image (1Fusion 1Red 1Green) showing the (C) t(12;22) with the 3’ZNF384 signal(spectrum green) on the derivative(der) chromosome 22 (UPN. No FS 62/19) (D) t(12;19) with the 3’ZNF384 signal (spectrum green) on the derivative chromosome 19 (UPN. No FS 42/19) (E) Representative image of G-banded karyotype showing the reciprocal t(12;17) (F) Inverted DAPI view of metaphase FISH image showing the t(12;17) with the 3ZNF384 signal(spectrum green) on the derivative chromosome 17 (UPN. No FS 39/19)

