Figure 2:

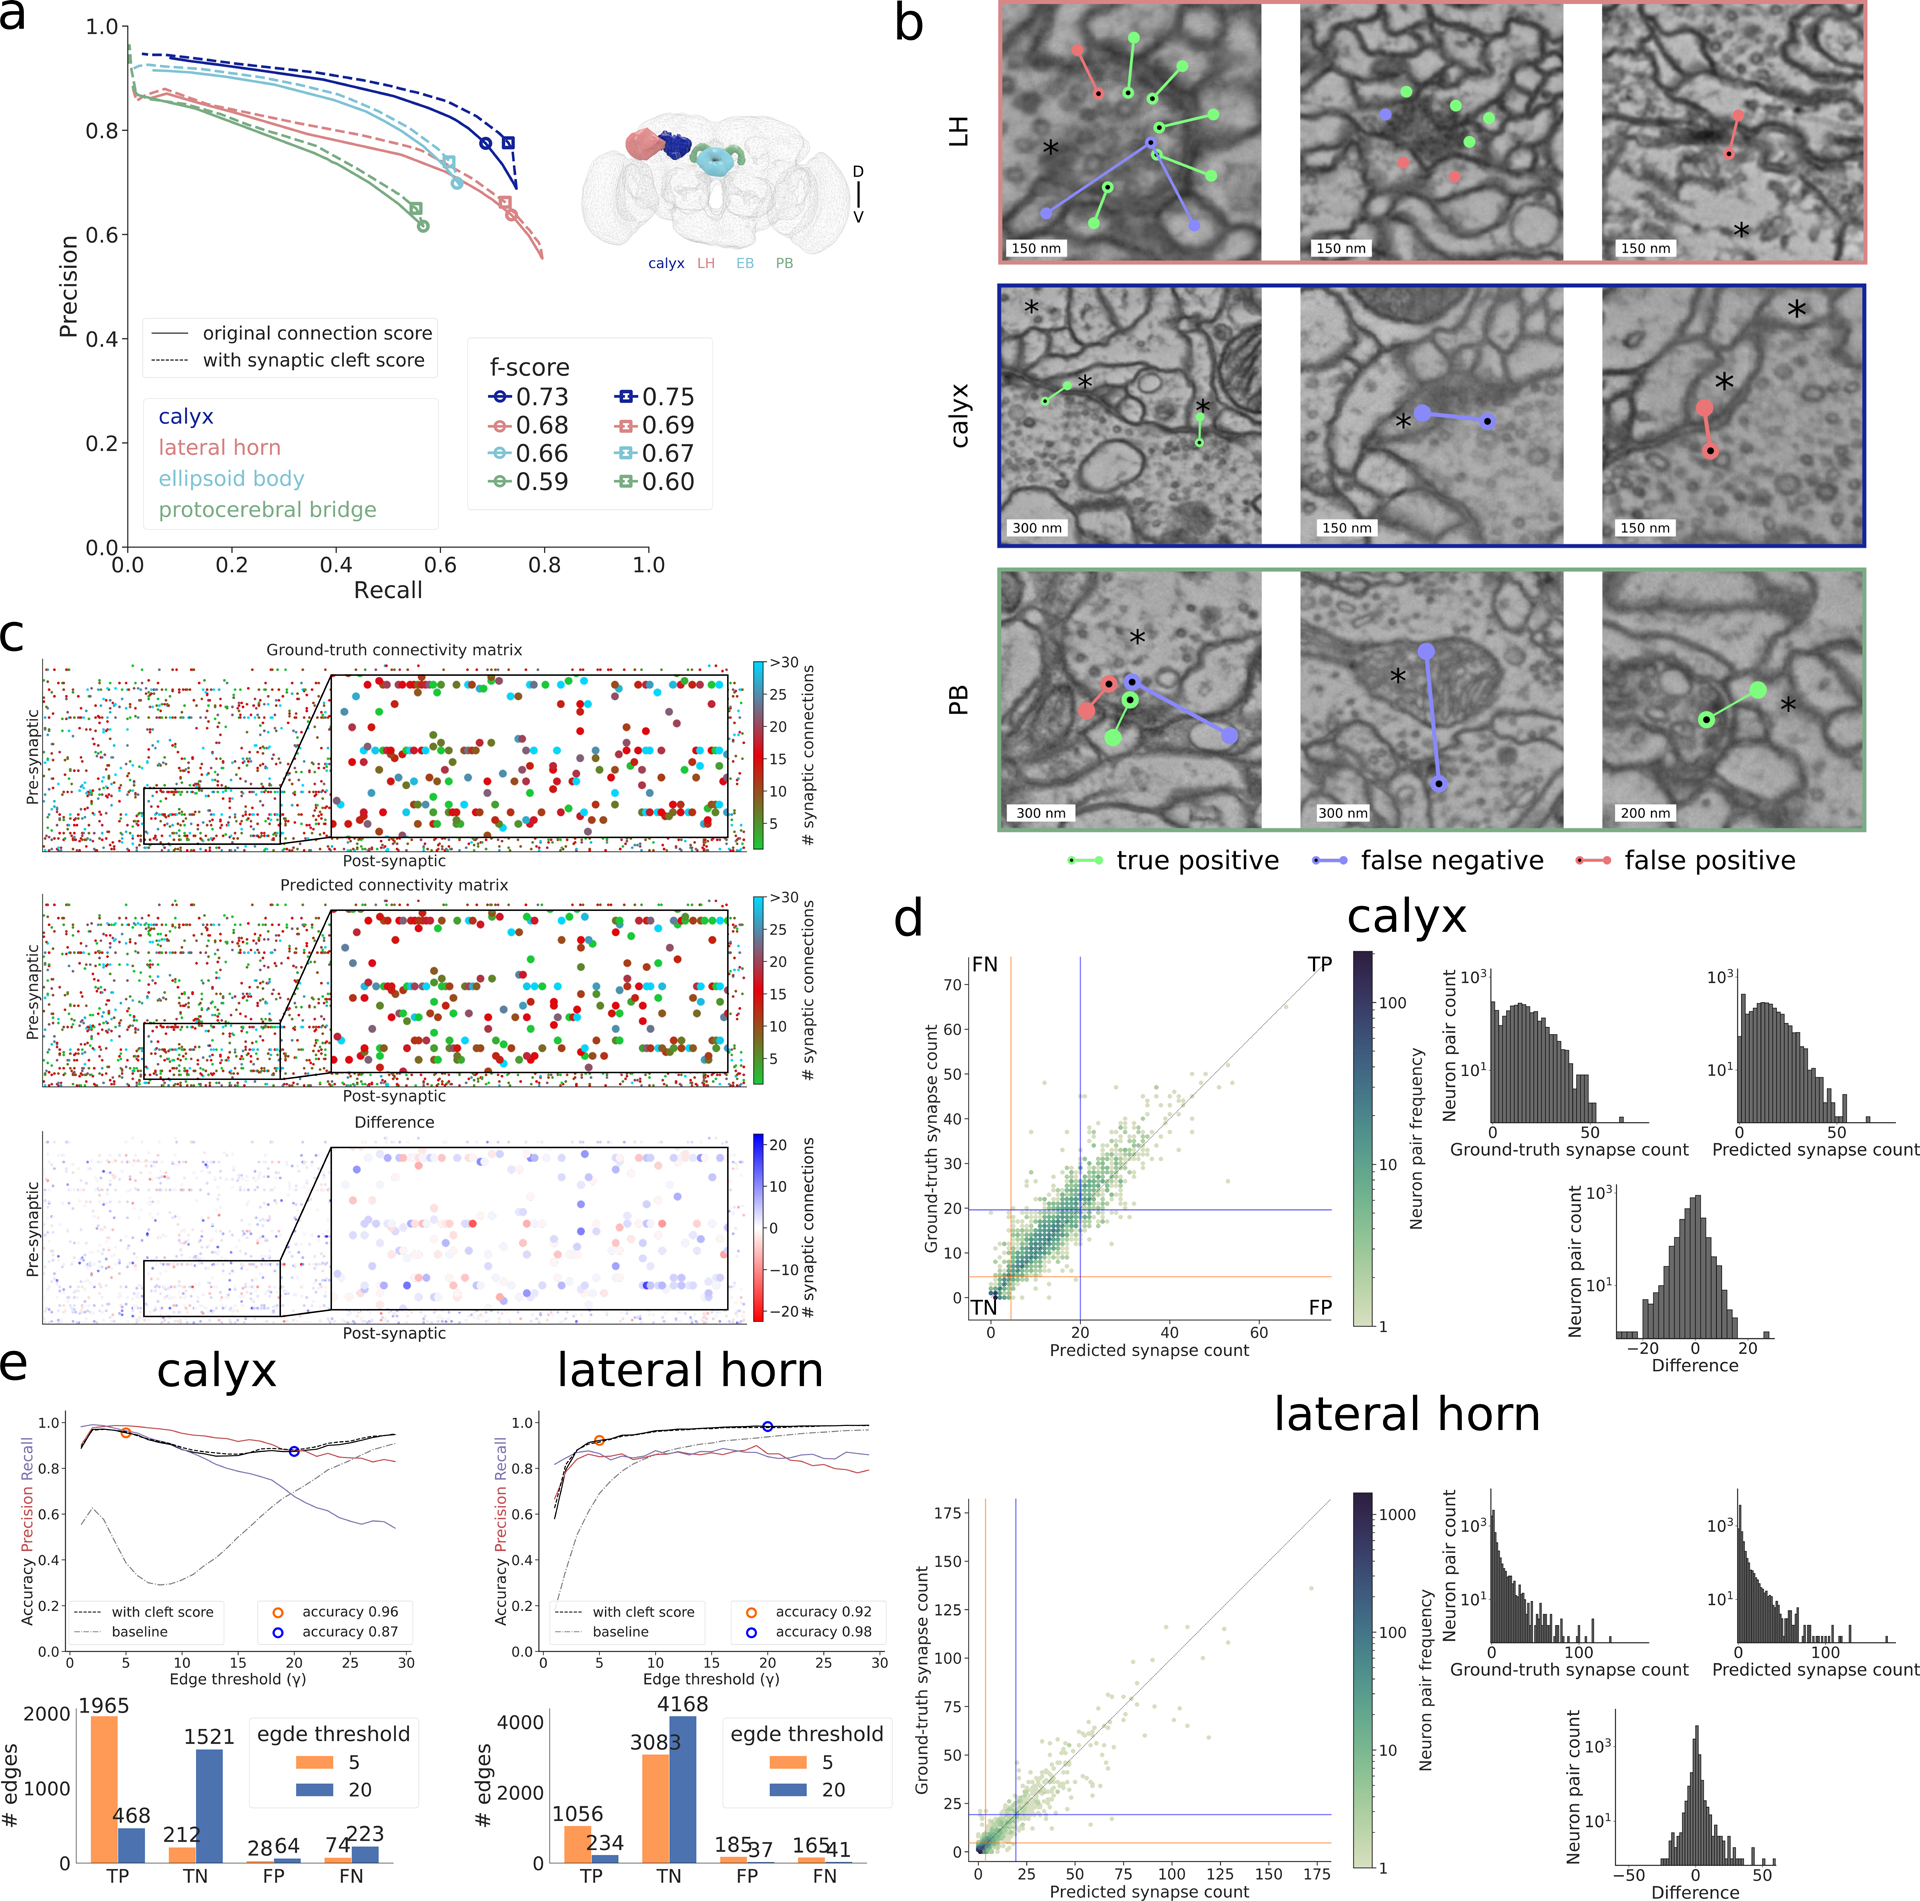
Results in whole-brain FAFB dataset. a Precision-recall curves using the Cremi metric for the four different brain regions calyx (dark blue), lateral horn (peach), ellipsoid body (light blue) and protocerebral bridge (green) over different prediction score thresholds, with (solid) and without (dashed) filtering via synaptic cleft predictions [6] (Supplementary Note 2). Markers highlight validation best score threshold (f-score with cleft predictions: 0.75, 0.69, 0.67, 0.60 for calyx, lateral horn, ellipsoid body, and protocerebral bridge, respectively). b Examples of identified true positives, false positives, false negatives in lateral horn (top row), calyx (middle row), and protocerebral bridge (bottom row) on ground-truth neurons (marked with an asterisk). False positive in top row left, false positives and false negative in top row middle are examples of ambiguous cases, false negative in bottom row middle is an example of a missed axo-axonic connection. c Ground-truth, predicted, and difference of number of synaptic connections between 138 projection neurons (pre-synaptic) and 528 Kenyon cells (post-synaptic) in calyx. d For calyx, same data as in (c), shown as ground-truth versus predicted count of number of synaptic connections between pairs of neurons and equivalent plot for lateral horn. Pairs with both zero connections in ground-truth and prediction are omitted. Orange/blue line quadrants highlight false negative (FN), true positive (TP), false positive (FP), and true negative (TN) edges for two connectivity criteria, i.e., number of synapses equal or greater than γ = 5 (orange) and γ = 20 (blue). Histograms on the right show the respective frequency distributions of number of synaptic connections per edge. e Edge accuracy, precision, and recall over different connectivity thresholds γ for calyx (left) and lateral horn (right). Accuracy results for thresholds γ = 5 and γ = 20 are highlighted and their absolute numbers of TPs, TNs, FPs, FNs are provided in the bar plots below. Connectivity derived from neuron-proximity is shown as “baseline” (Supplementary Note 2).
