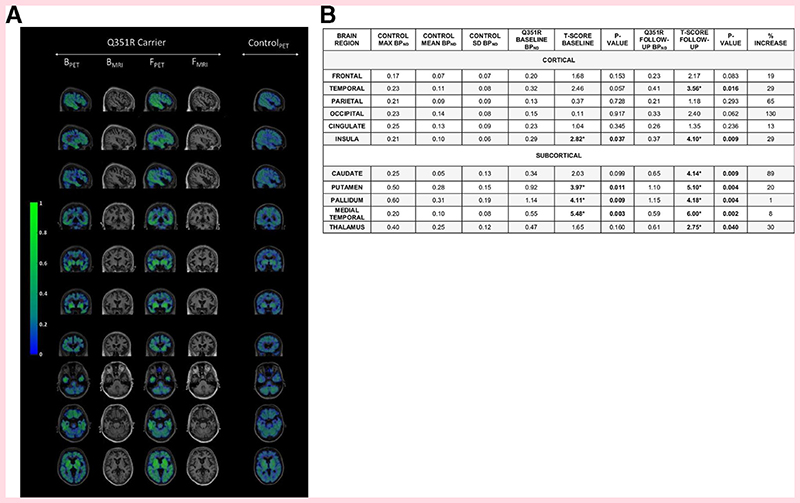
Figure 1.
(A) BPND of (18F)AV-1451 in a Q351R MAPT mutation carrier, at baseline and follow-up 1 year later and a representative age-matched control participant. Sagittal, coronal and axial views are displayed for PET images for all participants, as well as T1-weighted MR images for the mutation carrier. Areas of maximal BPND in the patient at baseline were the medial temporal, pallidum, putamen and insula regions, with the addition of the temporal cortex, thalamus and caudate at follow-up. (B) BPND max, mean and SD in controls, with BPND and T-scores in the patient with the Q351R MAPT mutation at baseline and follow-up, with percentage increase in BPND between baseline and follow-up. Bold represents a significant difference between the patient and controls. B, baseline; BPND, non-displaceable binding potential; F, follow-up; max, maximum; MAPT, microtubule associated protein tau; PET, positron emission tomography

