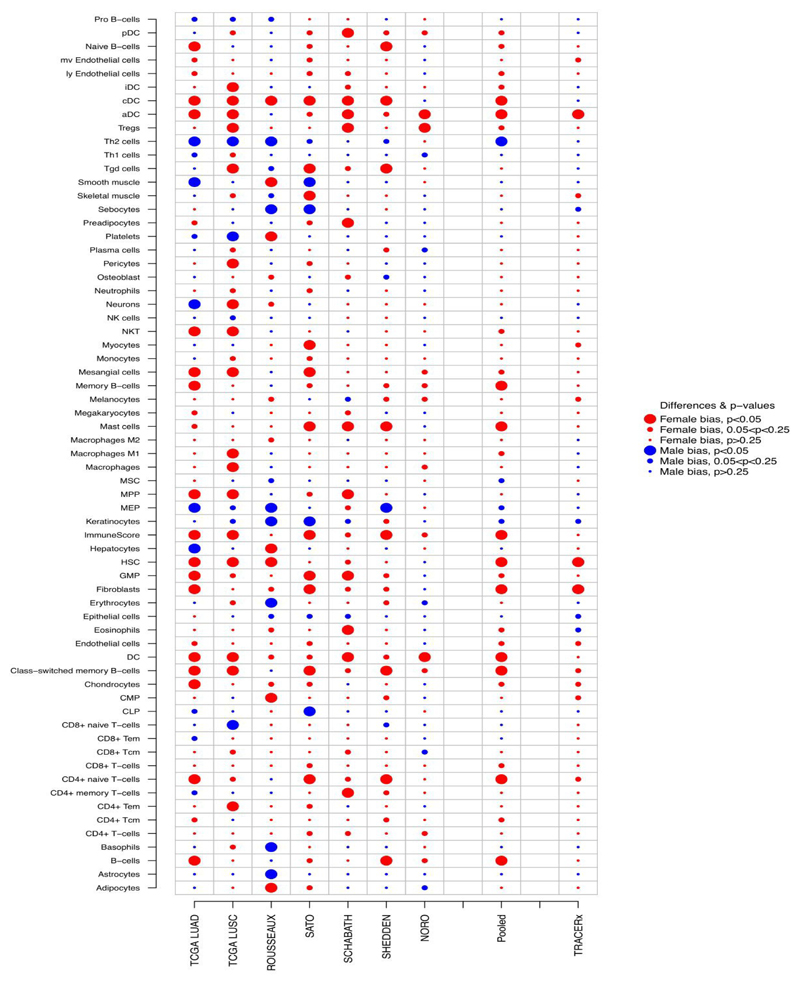
Figure 1. Summary plot of sex-based differences in the cell type composition of the immune-infiltrate.
Figure shows, for each of the 7 LCE-project dataset, p- values for the difference between the Enrichment Score (ES) of female tumors and male tumors based on a multiple linear regression model adjusted by age, smoking status, tumor-histotype and. Pooled p-values were calculated using random-effects models and corrected for FDR. Female bias (legend) stands for immune-cell types found enriched in the tumor microenvironment of female patients as compared with males (i.e., estimates for the difference in ES higher than 0); male bias (legend) stands for immune-cell types found enriched in the tumor microenvironment of male patients (i.e., estimates for the difference in ES lower than 0). For the TRACERx dataset p-values for the difference between the ES of female tumors and male tumors based on a linear regression model were reported.

