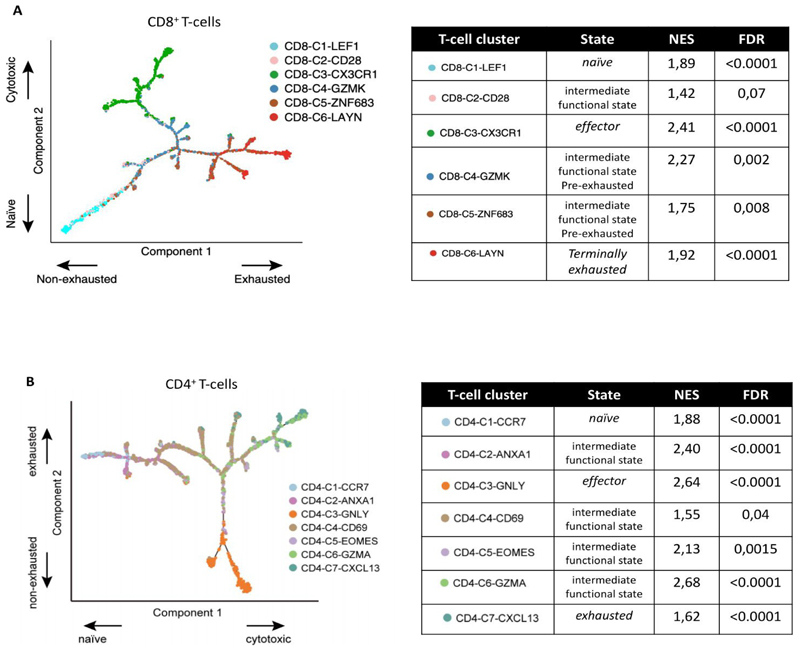
Figure 2. Sex-based differences in abundance of specific CD8+ (panel A) and CD4+ (Panel B) T-cell subpopulations.
Figures in panel A and B, show respectively the branched trajectory of CD8+ T and CD4+ T cells state transition in a two-dimensional state-space as described in Guo et al. Each dot corresponds to a T-cell subpopulation, colored according to its cluster label. Arrows show the increasing directions of certain T cell properties.
Tables in panel A and B report sex-based difference in abundance of each specific CD8+ T and CD4+ cell subpopulation: NES >0 indicates enrichment in tumors of women, NES<0 in tumors of men

