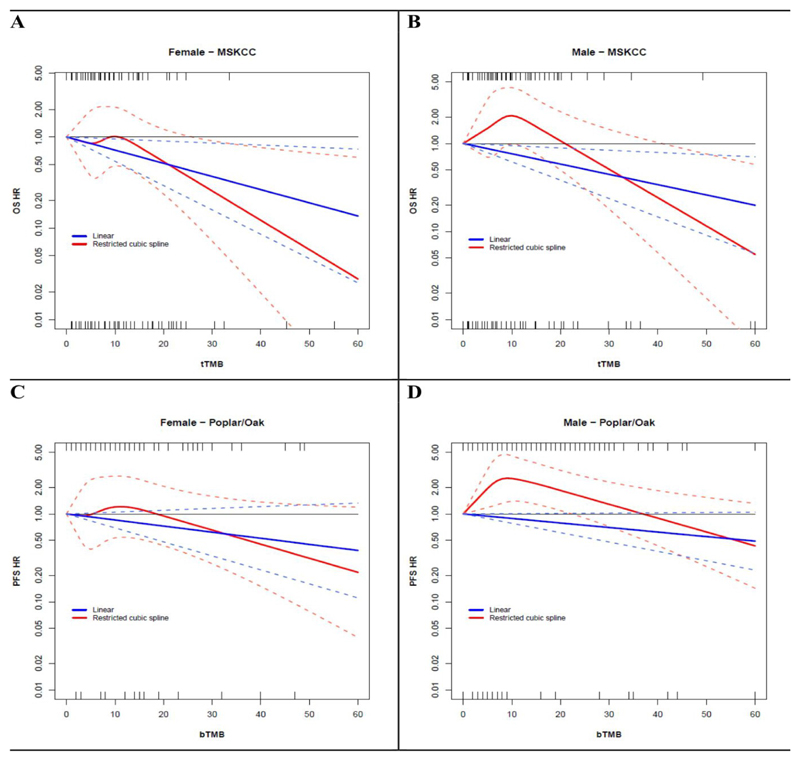
Figure 5. OS and PFS by TMB and gender.
Panel A and B show the dose-response association between tissue-TMB (treated as a continuous variable) and the hazard of death (OS-HR), assessed respectively in women and in men.
Continuous blue and red lines indicate associations modelled through linear versus a restricted cubic spline (RCS) models, respectively. Dotted lines represent 95% confidence intervals.
Rug plots for the distribution of TMB in patients with the event (death) and without the event (alive) are reported in the top and in the bottom of the graph, respectively.
Panel C and D show the adjusted dose-response association between blood-TMB (treated as a continuous variable) and the hazard of disease progression or death (PFS-HR), assessed respectively in women and in men. Adjustment factors were age, tumor histology, number of metastatic sites at enrollment, sum of longest diameter of target lesions at baseline, smoking history and PD-L1 expression levels.
Continuous blue and red lines indicate associations modelled through linear versus a restricted cubic spline (RCS) models, respectively. Dotted lines represent 95% confidence intervals.
Rug plots for the distribution of TMB in patients with the event (progressed) and without the event (not progressed) are reported in the top and in the bottom of the graph, respectively

