. 2021 May 26;14(8):811–822. doi: 10.1158/1940-6207.CAPR-20-0620

Figure 2.

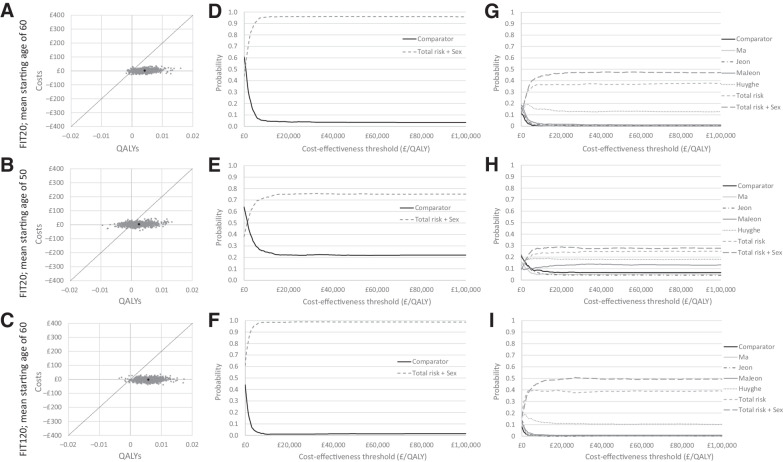
Figure 2. Cost-effectiveness planes (A–C) and cost-effectiveness acceptability curves (D–I) comparing probabilistic sensitivity analysis results for risk-stratification using the Total Risk + Sex score (based on a mean starting age of 60 or 50 and at a FIT threshold of 120 or 20), against inviting all at age 60 or age 50 respectively or against other risk scores.

Cost-effectiveness planes (A–C) and cost-effectiveness acceptability curves (D–I) comparing probabilistic sensitivity analysis results for risk-stratification using the Total Risk + Sex score (based on a mean starting age of 60 or 50 and at a FIT threshold of 120 or 20), against inviting all at age 60 or age 50 respectively or against other risk scores.