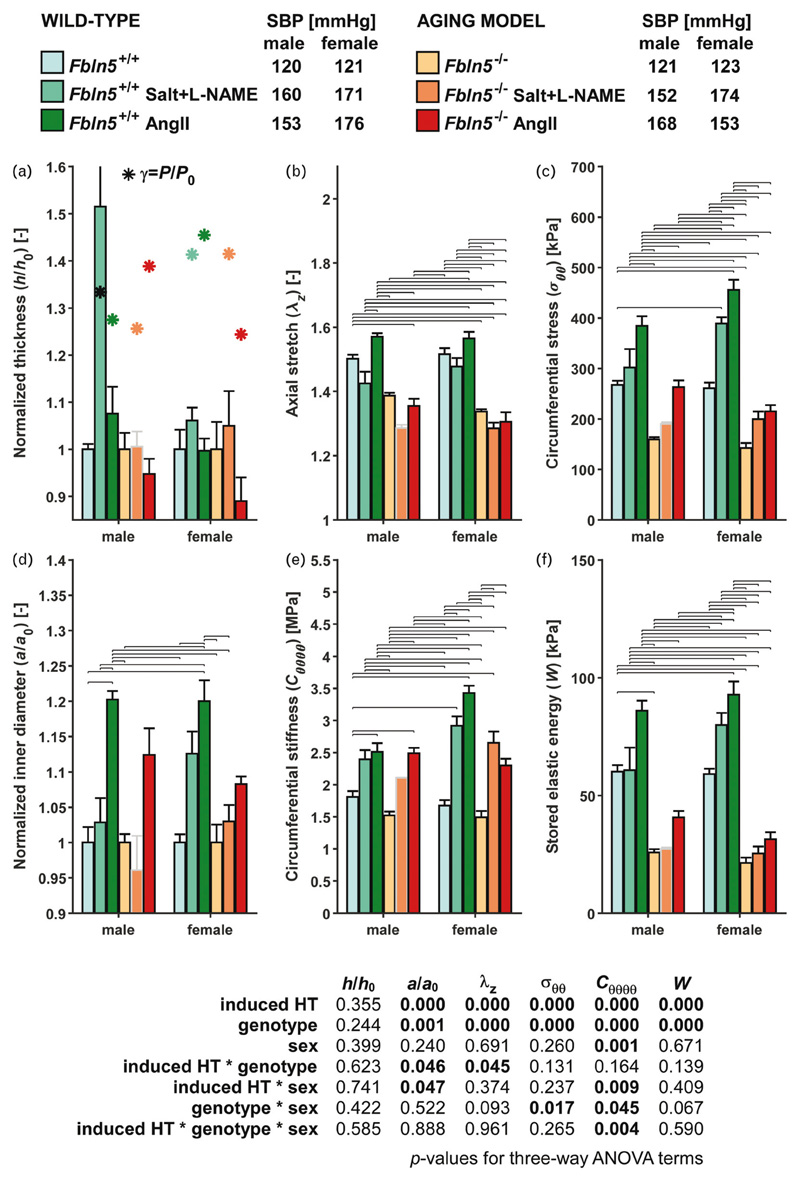
Figure 2.
Select biomechanical metrics for the descending thoracic aorta (DTA), computed at group-specific systolic blood pressures (SBPs) and individual axial stretch, for all six primary groups and both sexes (12 groups). A subscript ‘o’ denotes original/homeostatic. Bars and whiskers indicate arithmetic means and standard errors; asterisks in panel (a) represent values for a perfect mechano-adaptation given a constant cardiac output (). Horizontal lines indicate significant differences (P < 0.05). Bonferroni post-hoc test following three-way analysis of variance (ANOVA); see Table S6]. The whisker for the male Fbln5 +/+ + Salt+l-NAME group in panel A (representing a standard error of 0.32) was truncated to avoid compression of the other bars. The male Fbln5 –/– + Salt+l-NAME group (bar and whisker outlined in gray) was not included in post-hoc testing due to low sample size (n = 2). Group sizes: males: females. Note the lack of mechano-adaptation of all hypertensive groups, independent of sex-NAME, Nv-nitro-L-arginine methyl ester.

