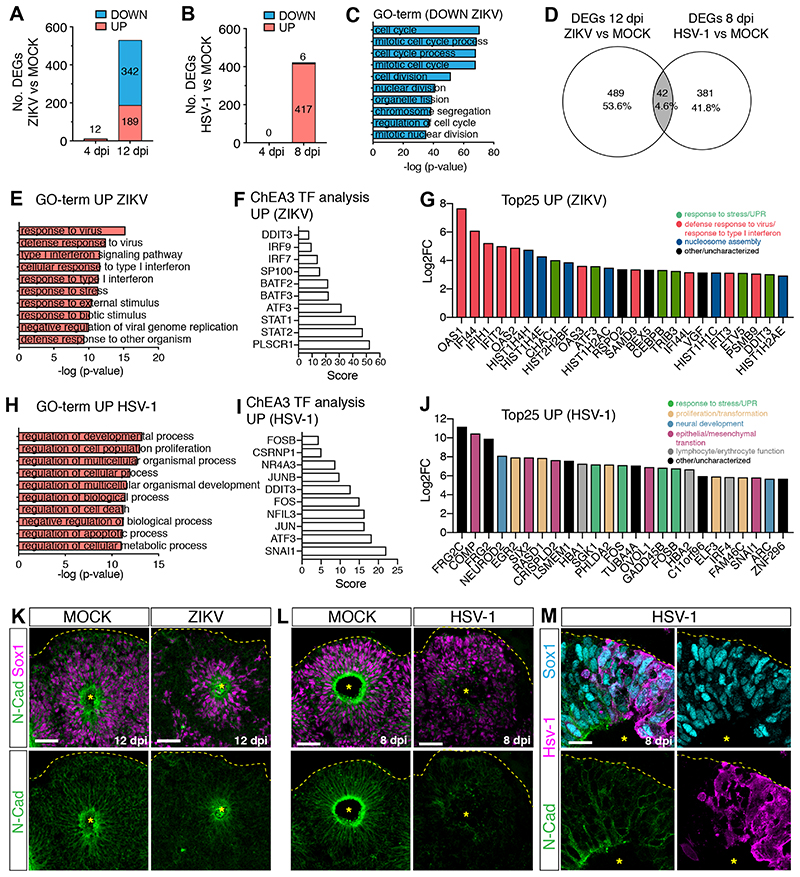
Figure 2. ZIKV and HSV-1 infections elicit distinct transcriptional responses.
A-B) Graphs showing the number of differentially expressed genes (DEGs) in virus-infected organoids.
C) Top 10 Gene Ontology (GO)-terms of downregulated genes (log2FoldChange <1) in ZIKV vs. MOCK-exposed organoids (12 dpi).
D) Venn diagram showing limited overlap between the two datasets.
E and H) Top 10 GO-terms of upregulated genes (log2FoldChange >2) in virus-infected organoids (12 dpi in E, 8 dpi in H).
F and I) Top 10 results of ChEA3 transcription factor (TF) analysis performed on upregulated genes.
G and J) Expression of the top 25 upregulated genes in ZIKV-infected organoids (12 dpi, in G) or in HSV-1-infected organoids (8 dpi, in J). FC, fold change.
K-M) Immunostaining (scale bars 50 μm in K-L, 20 μm in M) of infected and MOCK-treated organoids. Dashed lines and asterisks indicate organoid surface based on DAPI signal (not shown) and lumen respectively.

