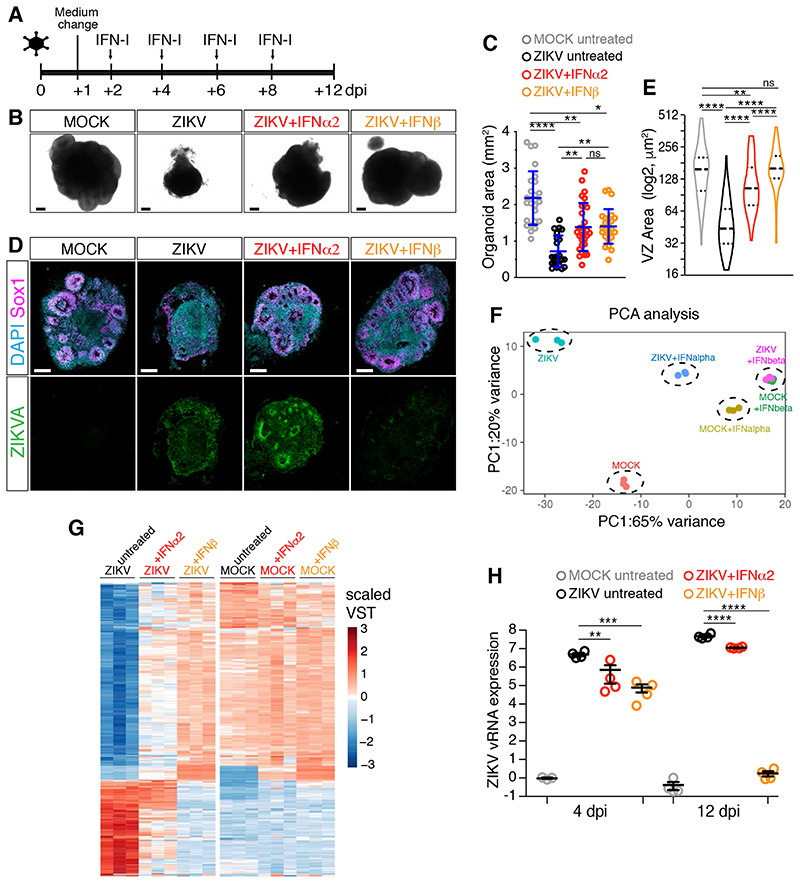
Figure 5. IFNβ treatment prevents ZIKV-induced organoid defects.
A) Timeline of interferons (IFN-I) treatment. Organoids were analyzed at 12 dpi.
B-C) Images (scale bars 200 μm) of organoids treated as in A and area quantification. Values are mean ± SD and represent individual organoids (**** is p<0.0001, p=0.0063 ZIKV+IFNα2 vs ZIKV, p=0.0021 ZIKV+IFNβ vs ZIKV, p>0.9999 ZIKV+IFNα2 vs ZIKV+IFNβ, p=0.0015 ZIKV+IFNα2 vs MOCK, p=0.0117 ZIKV+IFNβ vs MOCK, Kruskal-Wallis test).
D-E) Immunostaining (scale bars 200 μm) of organoids and area quantification of ventricular zone (VZ)-like regions. Violin plots show median and quartiles (n=114 regions from 6 MOCK organoids, n=55 from 7 ZIKV organoids, n=73 from 7 ZIKV+IFNα2 organoids, n=106 from 7 ZIKV+IFNβ organoids; p=0.0026 ZIKV+IFNα2 vs MOCK; p>0.9999 ZIKV+IFNβ vs MOCK; **** is p<0.0001; Kruskal-Wallis test).
F-G) Principal Component Analysis (PCA) and expression (in scaled variance stabilizing transformation or VST) of differentially expressed genes.
H) Quantification of ZIKV viral RNA (vRNA) expression measured by RT-qPCR in organoids treated as in A. Values are mean ± SEM (4dpi: p=0.0017 ZIKV+IFNα2 vs ZIKV, p=0.0005 ZIKV+IFNβ vs ZIKV; **** is p<0.0001; one-way ANOVA Tukey’s multiple comparisons test). dpi, days post-infection; ns, non-significant. See also Figure S5 and Table S2.

