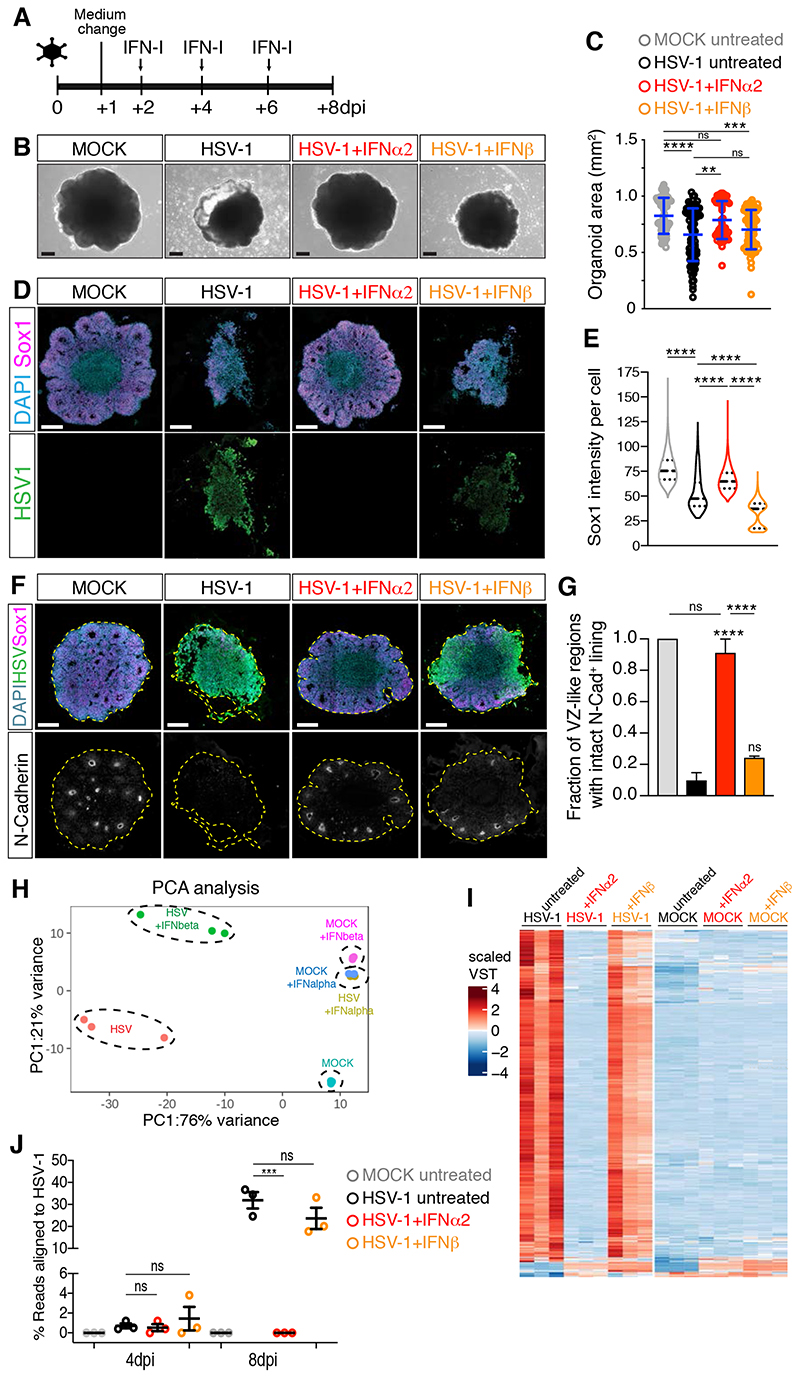
Figure 6. IFNβ treatment fails to prevent HSV-1-induced organoid defects.
A) Timeline of IFN-I administration. Organoids were analyzed at 8 dpi.
B-C) Images (scale bars 200 μm) and area quantification of organoids treated as in A. Values are mean ± SD (**** is p<0.0001; p=0.0043 HSV+IFNα2 vs HSV; p>0.9999 HSV+IFNβ vs HSV; p=0.0587 HSV+IFNα2 vs HSV+IFNβ; p>0.9999 HSV+IFNα2 vs MOCK; p=0.0007 HSV+IFNβ vs MOCK; Kruskal-Wallis test).
D and F) Immunostaining (scale bars 200 μm) of organoids. Dashed lines indicate organoid contour.
E) Quantification of Sox1 mean intensity per cell. Violin plots show median and quartiles (n>3000 cells from at least 3 organoids per condition, **** is p<0.0001, Kruskal-Wallis test).
G) Quantification of the ventricular zone (VZ)-like regions marked by N-Cadherin (N-Cad) apical accumulation. Data are mean ± SEM (n=3 experiments; **** is p<0.0001, ns is p>0.9999; Kruskal- Wallis test).
H-I) Principal Component Analysis (PCA) and expression (in scaled variance stabilizing transformation or VST) of genes differentially expressed in HSV-1-infected organoids.
J) Percentage of RNA-sequencing reads aligned to the HSV-1 genomic sequence. Values are mean ± SEM (for 4 dpi: p=0.8613 MOCK vs HSV, p=0.9975 HSV+IFNα2 vs HSV, p=0.8447 HSV+IFNβ vs HSV; for 8 dpi: p=0.003 MOCK vs HSV, p=0.0003 HSV+IFNα2 vs HSV, p=0.2943 HSV+IFNβ vs HSV, one-way ANOVA Tukey’s multiple comparisons test).
dpi, days post-infection; ns, non-significant. See also Figure S6 and Table S2.

