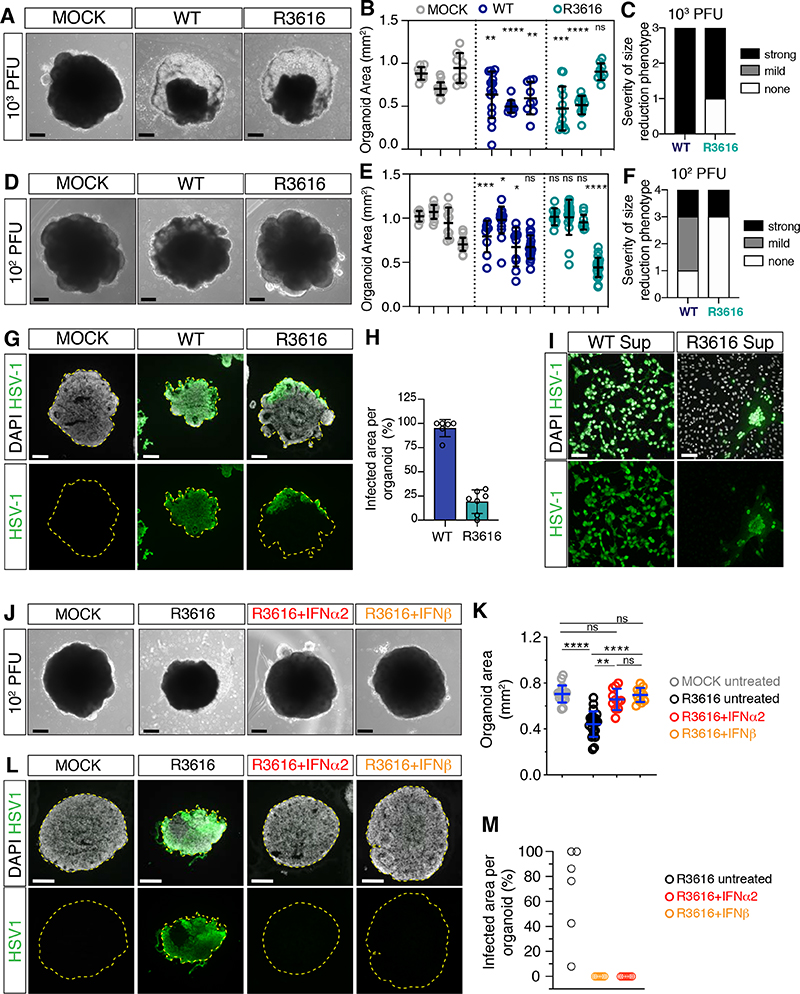
Figure 7. HSV-1 selectively counteracts IFNβ activity.
A-F) Images (scale bars 200 μm) and area quantifications of organoids exposed to HSV-1 wild type (WT), R3616 mutant or MOCK-treated and analyzed at 8 dpi. Values are mean ± SD and represent individual organoids (in B: for wt, p=0.0066 and p=0.0021; for R3616 p=0.0008 and p=0.7802; in E: for wt p=0.0002, p=0.02, p=0.0232 and p=0.1606; for R3616, p=0.8148, p=0.5701, p=0.7394; **** is p<0.0001; Mann-Whitney test comparisons to MOCK counterparts). Outcomes of infection experiments shown in C and F are based on statistical significance (strong if p<0.005, mild if 0.005<p<0.05 or none if p>0.05).
G-H) Immunostaining (scale bars 200 μm) and quantification of infected organoid area at 8 dpi. Dashed lines indicate organoid contour. Data are mean ± SD (n=6 organoids for WT, n=7 for R3616).
I) Immunostaining (scale bars 100 μm) of Vero cells incubated with supernatants (Sup) from HSV- 1 WT- or R3616-infected organoids at 8 dpi.
J-M) Images, immunostaining (scale bars 200 μm) and quantification of organoid infected area at 8 dpi. Refer to Figure 6 for comparison to wt HSV-1. Values in K are mean ± SD (n=6 untreated organoids, n=7 organoids for IFNα2 and IFNβ; **** is p<0.0001; ns is p p>0.9999; p=0.0020 R3616+IFNα2 vs R3616; Kruskal-Wallis test).
dpi, days post-infection; ns, non-significant. See also Figure S7, Table S1 and S2.

