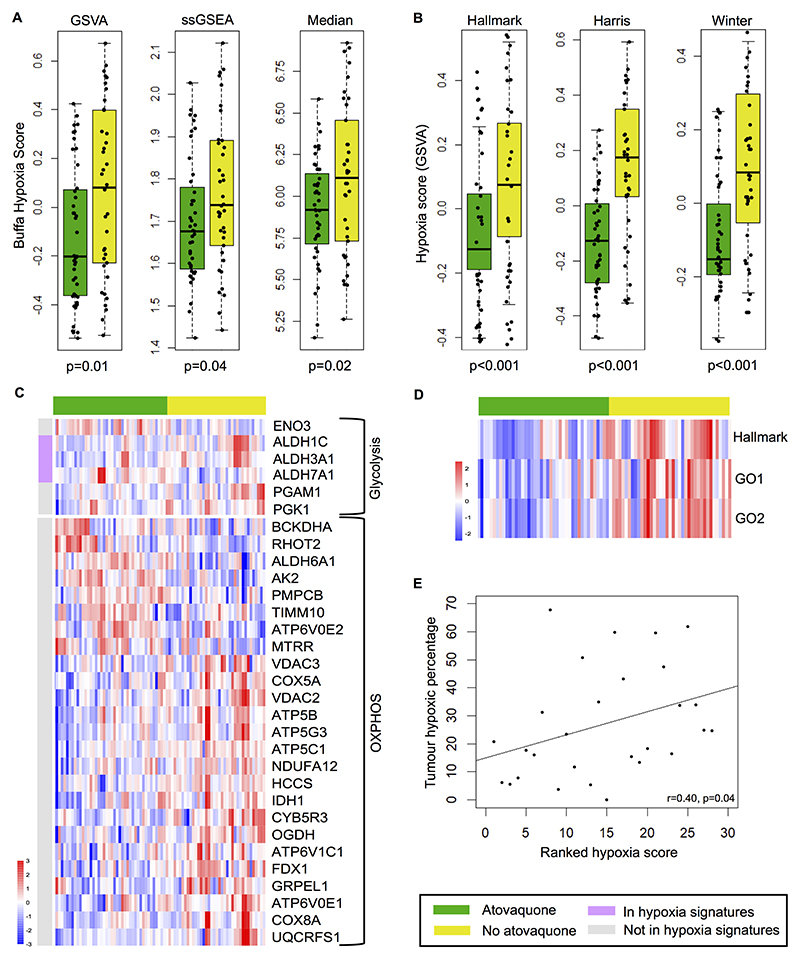
Figure 2. Altered expression of tumor hypoxia- and metabolism-related genes in atovaquone-treated patients as measured by RNAseq.
A) Box and whisker plots of the Buffa hypoxia gene signature expression score in atovaquone-treated and untreated tumor samples using GSVA, ssGSEA and median summarization methods. Each data point represents an expression score obtained from tissue from an entire cross section of tumor. B) GSVA scores for Hallmark, Harris and Winter hypoxia gene signatures. Median values, interquartile range and absolute range (minus outliers) are shown with independent sample t-test significance provided. C) Heatmaps illustrating differentially expressed KEGG glycolysis and oxidative phosphorylation (OXPHOS) genes between treatment groups. Genes present in any of the four hypoxia signatures are indicated by the pink bar. D) Heatmap showing lower expression of ROS associated genes in atovaquone-treated patients using Hallmark and Gene Ontology (GO1 and GO2) ROS signature GSVA scores. E) Positive correlation between Buffa GSVA hypoxia score and hypoxic tumor percentage as measured by hypoxia PET-CT.

