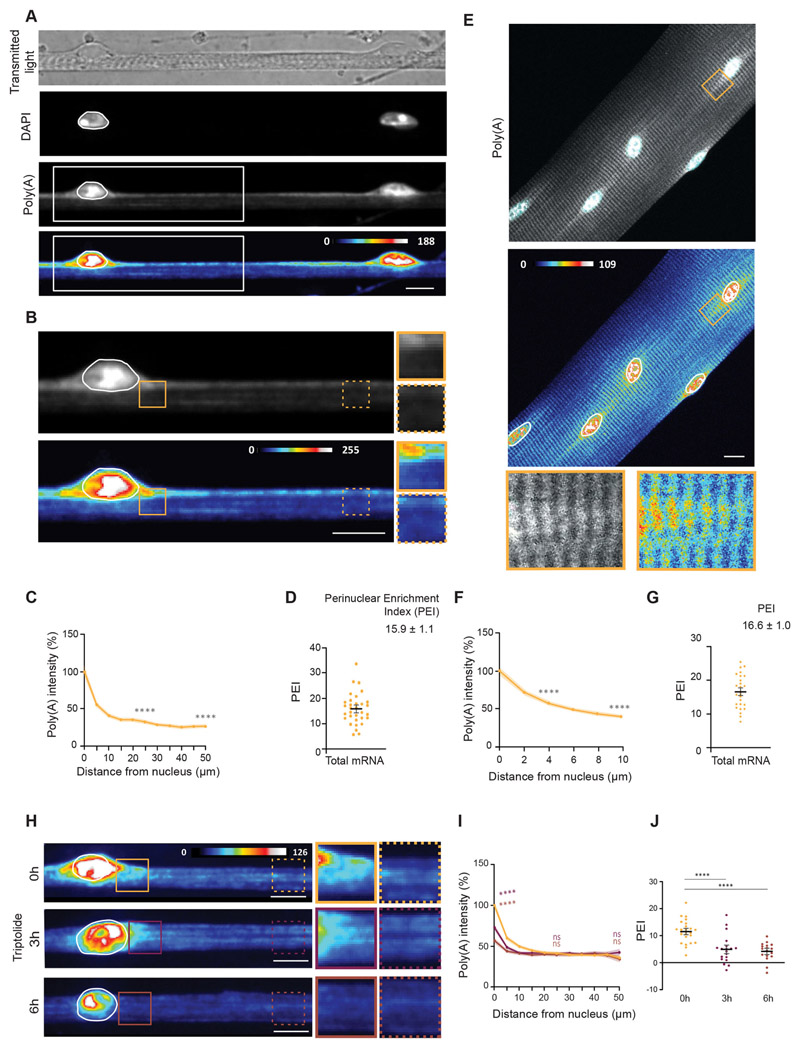
Fig. 1. Newly transcribed mRNA is enriched in the perinuclear region in skeletal muscle myofibers.
(A) Representative transmitted light, DAPI and FISH images, and FISH heatmap showing total mRNA in myofibers differentiated in vitro. The white line indicates a nucleus, determined using DAPI staining. White boxes indicate the region shown at 2× magnification in B. (B) Total mRNA FISH image and heatmap in the region highlighted in A. Images on the right show 1.5× magnifications of the perinuclear region (undashed box) and 50 μm away from the nucleus (dashed box). (C) Quantification of poly(A) intensity at different distances from the nucleus for myofibers differentiated in vitro, normalized to the average intensity close to the nucleus in each experiment. Mean±s.e.m. of 38 cell segments from three independent experiments. Statistical significance presented at 25 μm and 50 μm relative to 0 μm. (D) PEI, the percentage difference in total mRNA signal at 0 and 50 μm away from the nucleus. Mean±s.e.m. of 32 cell segments from three independent experiments. (E) Representative FISH image and heatmap of total mRNA in myofibers isolated from the EDL muscle of adult mice. A4× magnification of the highlighted area (box) is shown below, and nuclei are outlined in white. (F) Quantification of poly(A) intensity at different distances from the nucleus for myofibers isolated from the EDL muscle of adult mice, normalized to the average intensity close to the nucleus in each experiment. Mean±s.e.m. of 26 nuclei in five cells from two independent experiments. Statistical significance is presented at 4 μm and 10 μm relative to 0 μm. (G) PEI of total mRNA in myofibers isolated from the EDL muscle of adult mice. Mean ±s.e.m. of 26 nuclei in five cells from two independent experiments. (H) Representative FISH heatmaps of total mRNA distribution in in vitro myofibers treated for 3 and 6 h with 2 μMtriptolide. Nuclei are outlined in white. Images on the right show 1.5× magnifications of the perinuclear region (undashed box) and 50 μm away from the nucleus (dashed box). (I) Quantification of poly(A) intensity at different distances from the nucleus for myofibers treated with triptolide (color-coded as in H), normalized to the average intensity near the nucleus in untreated cells (0 h) of each experiment. Mean±s.e.m. of 33 (0 h), 35 (3 h) and 41 (6 h) cell segments, from four independent experiments. Statistical significance presented at 0 μm, 25 μm and 50 μm relative to untreated cells (0 h). (J) PEI of total mRNA in myofibers treated with triptolide for 0, 3 and 6 h. Mean±s.e.m. of 33 (0 h), 35 (3 h) and 41 (6 h) cell segments from four independent experiments. ****P<0.0001; ns, P>0.05 (one-way ANOVA with Tukey’s multiple comparisons test). FISH images are sum intensity projections and signal intensity is represented as heatmaps. Scale bars: 10 μm.

