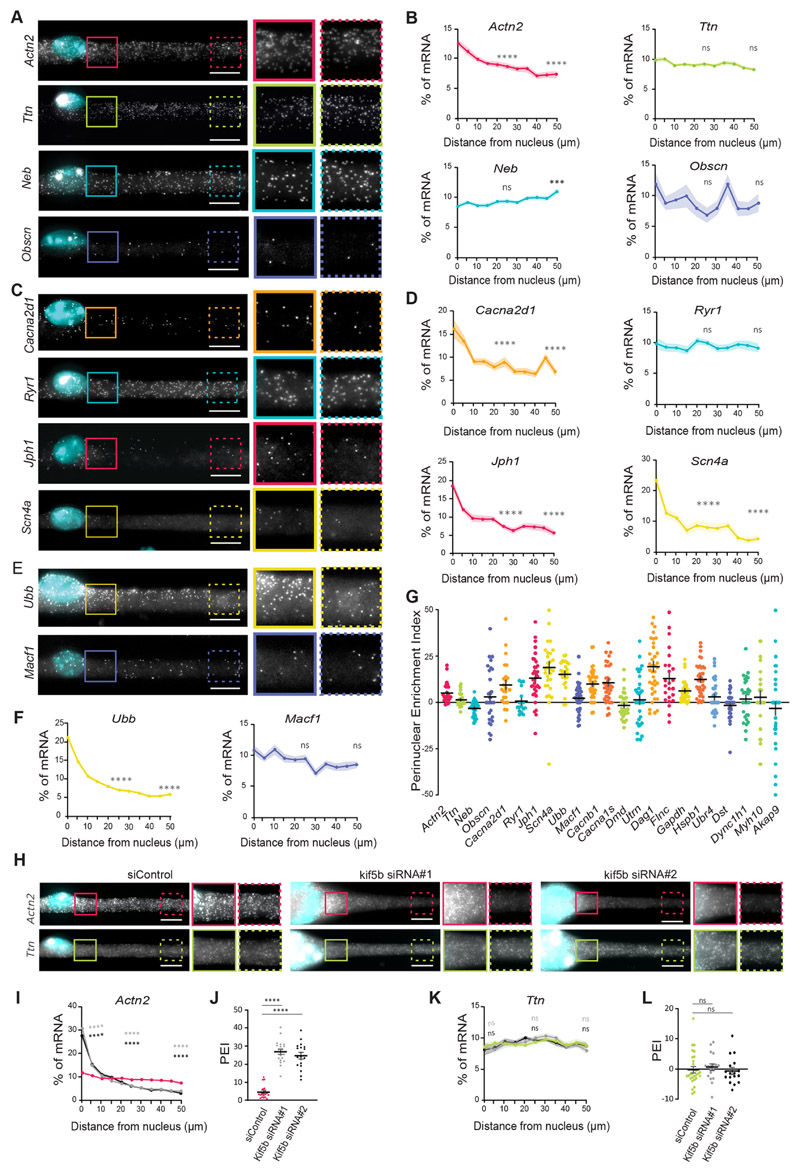
Fig. 2. A subset of mRNAs is spread throughout the myofiber independently of nuclear dispersion.
(A,C,E) Representative smFISH images of the distribution of Actn2, Ttn, Neb and Obscn (A); Cacna2d1, Ryr1, Jph1 and Scn4a (C); and Ubb and Macf1 (E) mRNAs. Images on the right show 1.5× magnifications of the perinuclear region (undashed boxes) and 50 μm away from the nucleus (dashed boxes) on the right. (B,D,F) Quantification of mRNA amount for the indicated mRNAs relative to distance to the nucleus (5 μm bins), normalized to total mRNA counts in each cell segment. Statistical significance is presented at 25 and 50 μm, comparing with 0 μm. Mean±s.e.m. of 28 (Actn2 and Ttn), 30 (Neb and Obscn), 24 (Cacna2d1 and Ryr1), 30 (Scn4a), 26 (Ubb) and 46 (Macf1) cell segments from three to four independent experiments. (G) Mean±s.e.m. PEI of the analyzed mRNAs. (H) Representative smFISH image of the distribution of Actn2 and Ttn mRNAs in cells transfected with control (siControl) and KIF5B siRNAs (kif5b siRNA#1 and kif5b siRNA#2). KIF5B depletion results in myofibers that exhibit nuclei aggregation. Images on the right for each condition show 1.5× magnifications of the perinuclear region (undashed boxes) and 50 μm away from the nuclei (dashed boxes). (I,K) Quantification of Actn2 (I) and Ttn (K) distribution in control and KIF5B-depleted myofibers, color-coded as in J and L, respectively. Mean±s.e.m. of 20 (siControl), 20 (siRNA#1) and 19 (siRNA#2) cell segments for Actn2 and 29 (siControl), 18 (siRNA#1) and 17 (siRNA#2) cell segments for Ttn mRNA from three independent experiments. Statistical significance presented at 0 μm, 25 μm and 50 μm relative to the control. (J,L) PEI of Actn2 (J) and Ttn (L) in control and KIF5B-depleted myofibers. Mean±s.e.m. of 20 (siControl), 20 (siRNA#1) and 19 (siRNA#2) cell segments for Actn2 and 29 (siControl), 18 (siRNA#1) and 17 (siRNA#2) cell segments for Ttn mRNA from three independent experiments. ****P<0.0001; ***P<0.001; ns, P>0.05 (one-way ANOVA with Tukey’s multiple comparisons test). smFISH images are maximum intensity projections. Scale bars: 10 μm.

