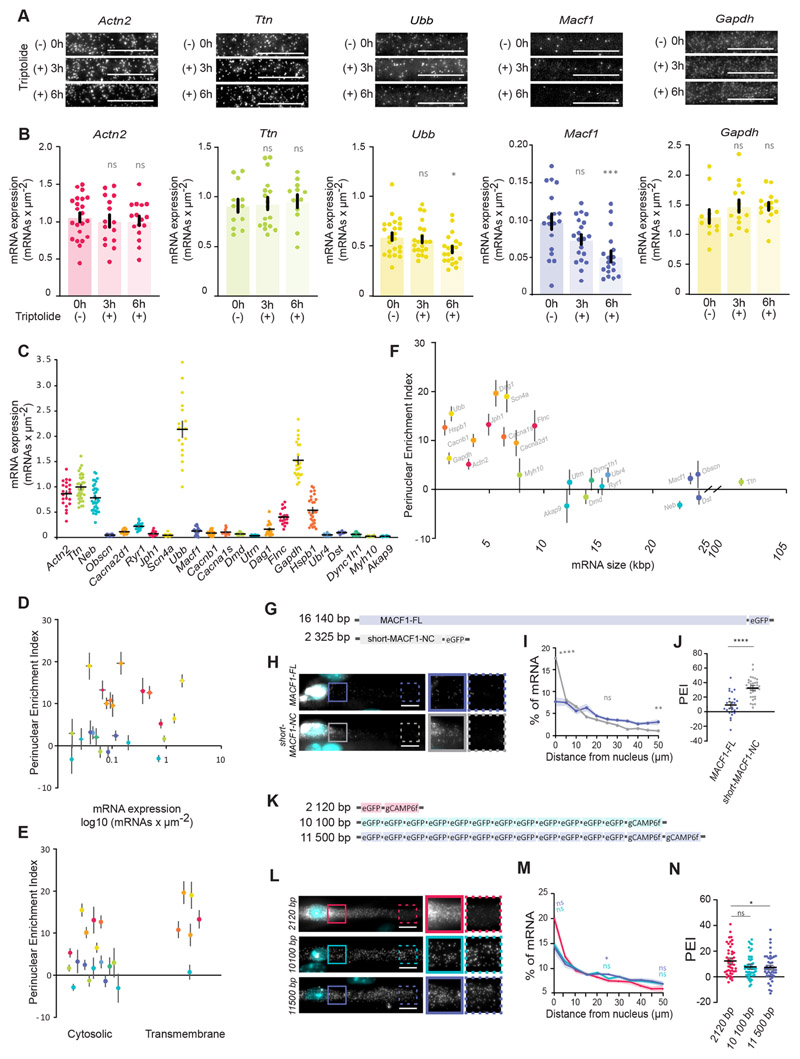
Fig. 3. mRNA size contributes to mRNA spreading.
(A) Representative smFISH images of Actn2, Ttn, Ubb, Macf1 and Gapdh mRNA 3 h and 6 h after 2 μM triptolide treatment in myofibers differentiated in vitro. (B) Quantification of Actn2, Ttn, Ubb, Macf1 and Gapdh mRNA number per μm2 between two adjacent nuclei, measured by smFISH, after 3 h and 6 h of 2 μM triptolide treatment. Mean±s.e.m. of 22, 15, 16 (Actn2); 12, 14, 12 (Gapdh); 12, 17, 12 (Ttn); 18, 20, 18 (Macf1); and 23, 22, 21 (Ubb) cell segments in 2-3 independent experiments for 0 h, 3 h and 6 h treatments, respectively. (C) Quantifications of transcript number per μm2 (mRNA expression level) measured by smFISH for all the mRNAs in this study. Mean±s.e.m. of 22 (Actn2), 33 (Ttn), 35 (Neb), (Obscn), 19 (Cacna2d1), 22 (Ryr1), 21 (Jph1), 22 (Scn4a), 17 (Ubb), 23 (Macf1), 29 (Cacnb1), 10 (Cacna1s), 22 (Dmd),13 (Utrn), 18 (Dag1), 16 (Flnc), 19 (Gapdh), 27 (Hspb1), 15 (Ubr4), 19 (Dst), 14 (Dync1h1), 16 (Myh10) and 28 (Akap9) cell segments in four to seven independent experiments. (D-F) Scatter plots illustrating the relationship between mean±s.e.m. PEI of each mRNA (warm colors for perinuclear-enriched and cold colors for spread mRNAs) and mRNA expression levels (D), characteristics of mRNA-encoded protein (E) and predicted mRNA size (F). (G) Schematic representation of full-length MACF1 (MACF1-FL) and shorter N- and C-terminal (short-MACF1-NC) eGFP fusion. (H) Representative smFISH images of MACF1-FL and short-MACF1-NC mRNAs. Images on the right show 1.5× magnifications of the perinuclear region (undashed box) and 50 μm away from the nucleus (dashed box). (I) Quantification of MACF1-FL and MACF1-NC mRNA distribution color-coded as in H. Mean±s.e.m. of 27 (MACF1-FL) and 37 (short-MACF1-NC) cell segments from five independent experiments. Statistical significance presented at 0 μm, 25 μm and 50 μm relative to MACF1-FL. (J) PEI of MACF1-FL and short-MACF1-NC mRNA. Mean±s.e.m. of 27 (MACF1-FL) and 37 (short-MACF1-NC) cell segments from five independent experiments. (K) Schematic representation of combinations of eGFP and GCaMP6f with different transcript sizes. (L) Representative smFISH images of eGFP and GCaMP6f mRNAs. Images on the right show 1.5× magnifications of the perinuclear region (undashed box) and 50 μm away from the nucleus (dashed box). (M) Quantification of eGFP and GCaMP6f mRNAs distribution color-coded as in L. Mean±s.e.m. of 45 (2120 bp), 50 (10,100 bp) and 45 (11,500 bp) cell segments from six independent experiments. Statistical significance presented at 0 μm, 25 μm and 50 μm. (N) PEI of eGFP and GCaMP6f mRNAs of the indicated transcript sizes. Mean±s.e.m. of 45 (2120 bp), 50 (10,100 bp) and 45 (11,500 bp) cell segments from six independent experiments. ****P<0.0001; ***P<0.001; **P<0.01; *P<0.05; ns, P>0.05 (one-way ANOVA with Tukey’s multiple comparisons test and two-tailed, unpaired Student’s t-test for comparisons between two experimental conditions). 95% confidence interval. Scale bars: 10 μm.

