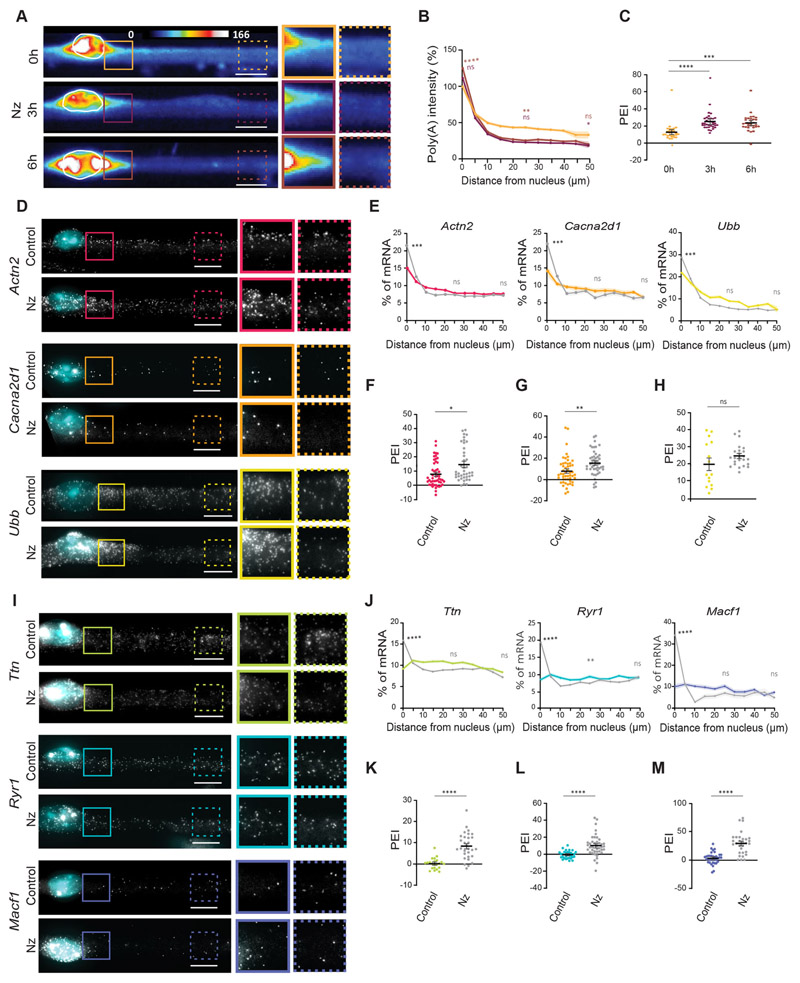
Fig. 5. mRNA distribution away from the nucleus of origin is perturbed by microtubule depolymerization.
(A) Representative FISH heatmaps of total mRNA in myofibers treated for 3 h and 6 h with 4 μg/ml nocodazole (Nz). Images on the right show 1.5× magnifications of the perinuclear region (undashed box) and 50 μm away from the nucleus (dashed box). (B) Quantification of poly(A) intensity at different distances from the nucleus (color-coded as in A), normalized to the average intensity near the nucleus in the 0 h (untreated) cells of each experiment. Mean±s.e.m. of 42-58 cell segments from four independent experiments. (C) PEI of total mRNA in myofibers treated for 3 h and 6 h with nocodazole. Mean±s.e.m. of 42-58 cell segments from four independent experiments. (D) Representative smFISH images of the distribution of Actn2, Cacna2d1 and Ubb mRNA in myofibers treated for 6 h with nocodazole. Images on the right show 1.5× magnifications of the perinuclear region (undashed box) and 50 μm away from the nucleus (dashed box). (E) Quantification of Actn2, Cacna2d1 and Ubb mRNA amount relative to distance to the nucleus in control and nocodazole-treated cells (color-coded as in F–H). Mean±s.e.m. of 51 and 40 (Actn2), 51 and 49 (Cacna2d1) and 22 and 36 (Ubb) cell segments, respectively, from three independent experiments. (F–H) PEI of Actn2 (F), Cacna2d1 (G) and Ubb (H) mRNA in control and nocodazole-treated cells. Mean±s.e.m. of 51 and 40 (Actn2), 51 and 49 (Cacna2d1) and 22 and 36 (Ubb) cell segments, respectively, from three independent experiments. (I) Representative smFISH images of the distribution of Ttn, Ryr1 and Macf1 mRNA in myofibers treated for 6 h with nocodazole. Images on the right show 1.5× magnifications of the perinuclear region (undashed box) and 50 μm away from the nucleus (dashed box). (J) Quantification of Ttn, Ryr1 and Macf1 mRNA amount relative to distance to the nucleus in control and nocodazole-treated cells (color-coded as in K–M). Mean±s.e.m. of 28 and 46 (Ttn), 32 and 41 (Ryr1) and 36 and 30 (Macf1) cell segments, respectively, from three independent experiments. (K-M) PEI of Ttn (K), Ryr1 (L) and Macf1 (M) mRNA in control and nocodazole-treated cells. Mean±s.e.m. of 28 and 46 (Ttn), 32 and 41 (Ryr1) and 36 and 30 (Macf1) cell segments, respectively, from three independent experiments. ****P<0.0001; ***P<0.001; **P<0.01; *P<0.05; ns, P>0.05 (two-tailed, unpaired Student’s t-test for comparisons between different conditions and the respective untreated control). smFISH images are maximum intensity projections. Scale bars: 10 μm.

