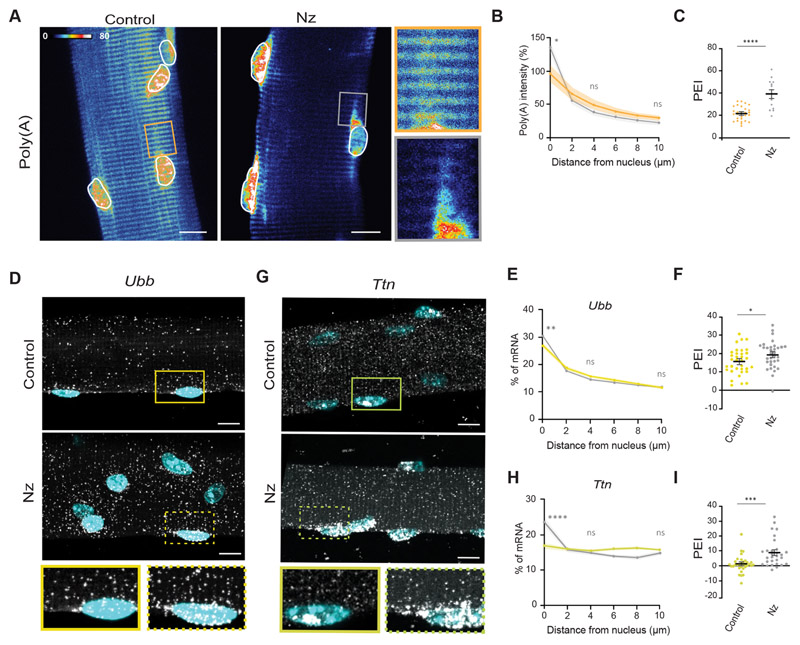
Fig. 6. mRNA distribution in ex vivo isolated fibers is perturbed by microtubule depolymerization.
(A) Representative FISH heatmap of total mRNA distribution in isolated myofibers treated for 9 h with 4 μg/ml nocodazole (Nz), compared with the untreated control. Images on the right show 3× magnifications of the highlighted regions (boxes). Nuclei are outlined in white. (B) Quantification of mean±s.e.m. poly(A) intensity at different distances from the nucleus in nocodazole-treated isolated myofibers (color-coded as in C), normalized to the average intensity close to the nucleus in the control (untreated) of each experiment. (C) PEI of total mRNA in control and nocodazole-treated myofibers. Mean±s.e.m. of 28 nuclei from six cells for the control and 14 nuclei from four cells for the nocodazole-treated sample from two independent experiments. (D) Representative smFISH images of Ubb mRNA distribution in control and nocodazole-treated isolated myofibers. Images beneath show 1.5× magnifications of the region around the single nuclei indicated by boxes. (E) Quantification of mean±s.e.m. Ubb mRNA amount relative to the distance to the nucleus (2 μm bins) in control and nocodazole-treated isolated myofibers (color-coded as in F). (F) PEI of Ubb mRNA in control and nocodazole-treated myofibers. Mean±s.e.m. of 29 and 34 nuclei, respectively, from 5-6 cells from three independent experiments. (G) Representative smFISH images of Ttn mRNA distribution in control and nocodazole-treated isolated myofibers. Images beneath show 1.5× magnifications of the region around the single nuclei indicated by boxes. (H) Quantification of mean±s.e.m. Ttn mRNA amount relative to the distance to the nucleus (2 μm bins) in control and nocodazole-treated isolated myofibers (color-coded as in I). (I) PEI of Ttn mRNA in control and nocodazole-treated myofibers. Mean±s.e.m. of 34 and 37 nuclei, respectively, from 5-6 cells from two independent experiments. ****P<0.0001; ***P<0.001; **P<0.01; *P<0.05; ns, P>0.05 (two-tailed unpaired Student’s t-test for comparisons between different conditions and the respective untreated control at 0 μm). smFISH images are maximum intensity projections. Scale bars: 10 μm.

