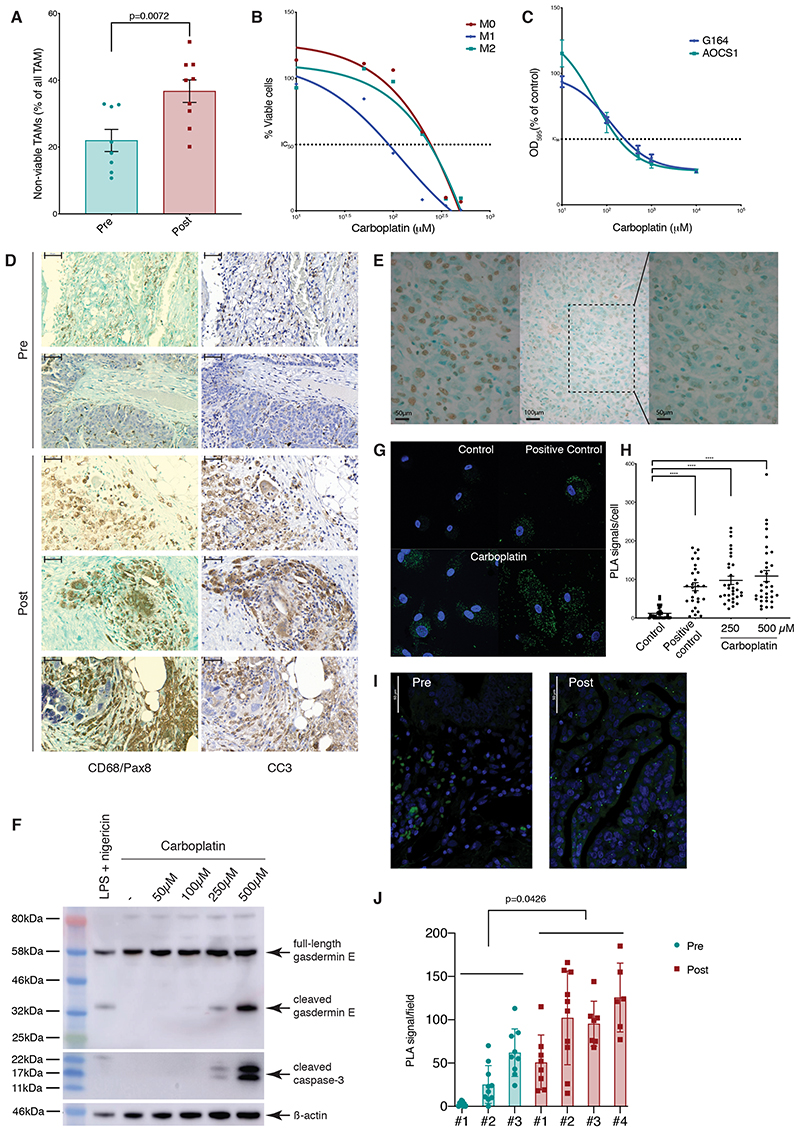
Figure 3. Effect of NACT on inflammasome activation.
(A) Flow cytometry analysis of human HGSOC omental metastases pre- and post-chemotherapy showing non-viable (FVD+) TAMs (Lin−HLA-DR+) as percentage of total TAMs in 8 (green) and 9 patients (red). (B) Human CD14+ monocytes, polarized to M1 (LPS/IFNγ), M2 (IL4/IL10), or M0 phenotypes, were treated with varying concentrations of carboplatin for 48 hours. Viable cells as percentage of single cells, normalized to media only control for each condition are shown from one experiment representative of two. IC50 values: M0=201.7μM, M1=93.5μM, and M2=203.3μM. (C) AOCS1 and G164 cells were treated with different concentrations of carboplatin for 48 hours. OD595 measurements for crystal violet staining are presented as average of three experiments, normalized to media-only control. IC50 values: G164=98.63μM, AOCS1=45.1μM. (D) Representative staining of five HGSOC omental biopsies pre- and post-chemotherapy from consecutive sections. Left: CD68 (brown), PAX8 (purple), green counterstaining. Right: cleaved caspase-3 (brown), blue counterstaining. Scale bar: 200μM. (E) Representative TUNEL staining within ‘macrophage lakes’ post-chemotherapy. Left: positive control, tissue incubated with DNAase prior to TUNEL staining. Center: post-chemotherapy HGSOC biopsy showing an region within a ‘macrophage lake’, x20 magification. Right: x40 magnification of the shaded area of the center image. Scale bar 50, 100, and 50 μM. (F) Western blot showing cleaved gasdermin E and caspase-3 in lysates from M2 macrophages treated with varying concentrations of carboplatin for 24 hours or LPS/nigericin as a positive control. Data relate to a single experiment. (G) PLA staining for ASC/NLRP3 interaction in M2-differentiated macrophages. Media only control, LPS/nigericin treated cells (positive control), cells treated with carboplatin 250μM (bottom left) and 500μM (bottom right) for 24 hours. Green specks indicate NLRP3 inflammasome complexes. Scale bar: 25μM. (H) Quantification of PLA signal per cell for one experiment. One-way ANOVA test was applied; ****p<0.0001. (I, J) PLA staining for ASC/NLRP3 interaction performed on pre- and post-chemotherapy HGSOC omental biopsies. Green specks indicate NLRP3 inflammasome complexes. Scale bar 50 μM. (J) Quantification of PLA signal from 3 pre- and 4 post-chemotherapy biopsies. P-value from the t-test comparing averages of pre- and post-chemotherapy is shown. Error bars represent SEM.

