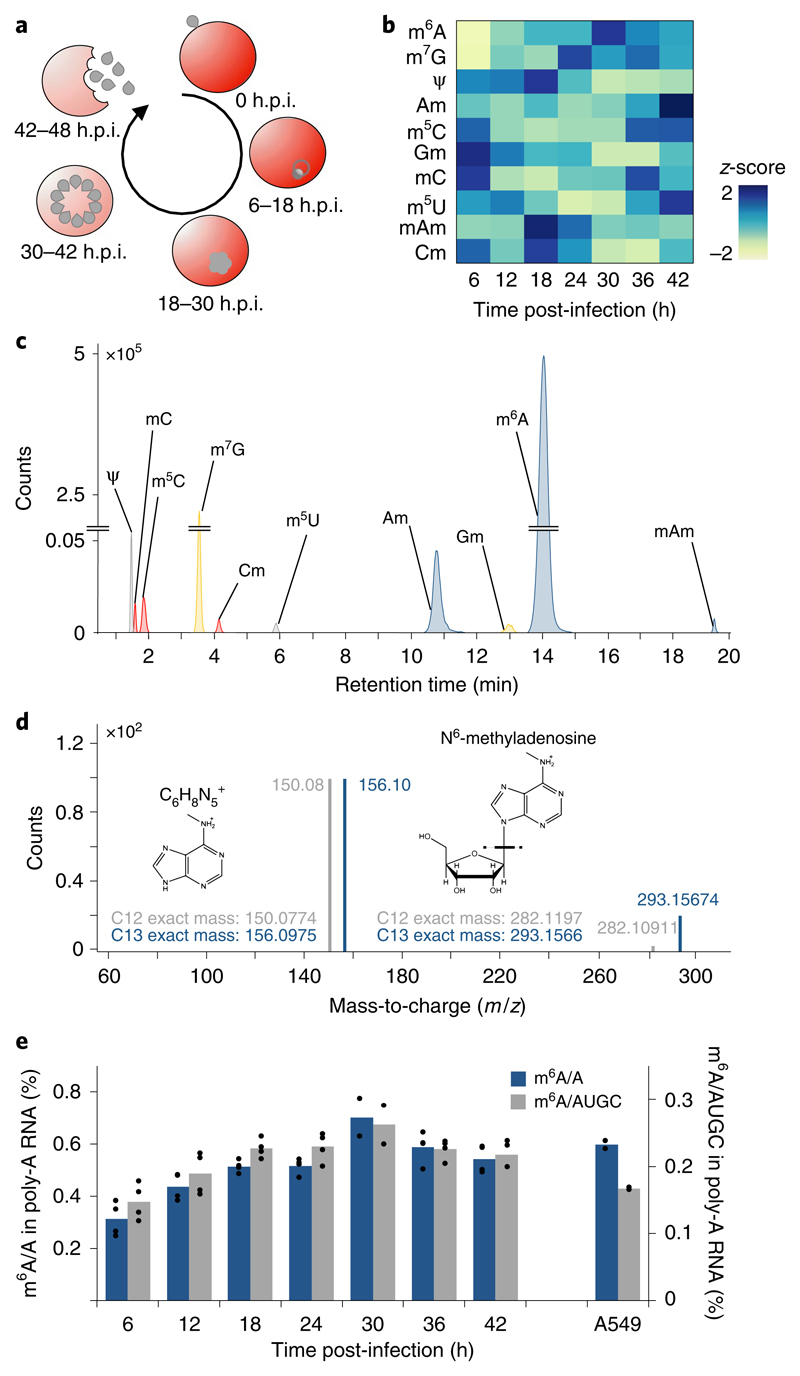
Fig. 1. global dynamics of mRNA modifications during the P. falciparum iDC.
a, Diagram illustrating the asexual replicative cycle of P. falciparum inside human RBCs including RBC invasion, host cell remodelling, replication via schizogony and RBC egress. b, Heatmap of normalized abundances (modification/canonical nucleotide) of ten mRNA modifications measured by LC-MS/MS at 6-h intervals over the course of the IDC (see also Supplementary Fig. 1d). Average of four biological replicates for each modification and timepoint, except 30 h.p.i. (n = 2). Blue indicates a high z-score while yellow indicates a low z-score (see Methods). c, LC-MS/MS extracted ion chromatograms of modified nucleotides analysed in parasite mRNA collected at 36 h.p.i. rC, cytosine; rU, uracil; rG, guanosine; rA, adenosine; m6A, N6-methyladenosine; m7G, N7-methyl-2’-guanosine; Ψ, pseudouridine; Am, 2’-O-methyladenosine; m5C, 5-methylcytosine; Gm, 2’-O-methylguanosine; mC, (3 or 4)-methylcytosine; m5U, 5-methyluridine; mAm, *-methyl-2’-O-methyladenosine; Cm, 2’-O-methylcytosine. d, Analysis of m6A by high-resolution mass spectrometry. Product ion spectrum of m6A in P. falciparum mRNA (grey) using heavy (C13) labelled E. coli tRNA (blue) as a standard. Fragmentation of m/z 282.12 (C12-red) and m/z 293.16 (C13-blue) leads to the breakage of the glycosidic bond resulting in the loss of the ribose sugar (132 Da) to form a daughter ion having a m/z 150.08 (C12-red) and m/z 156.10 (C13-blue). e, Global dynamics of calibrated m6A/A (blue) and m6A/AUGC (grey) levels across the asexual replicative cycle in 6-h intervals. As a reference, human A549 mRNA was analysed in parallel39. n = 4 for all time points except 30 h.p.i. (n = 2); n = 2 for human A549 samples. Points represent individual biological replicates with bars showing the mean.

