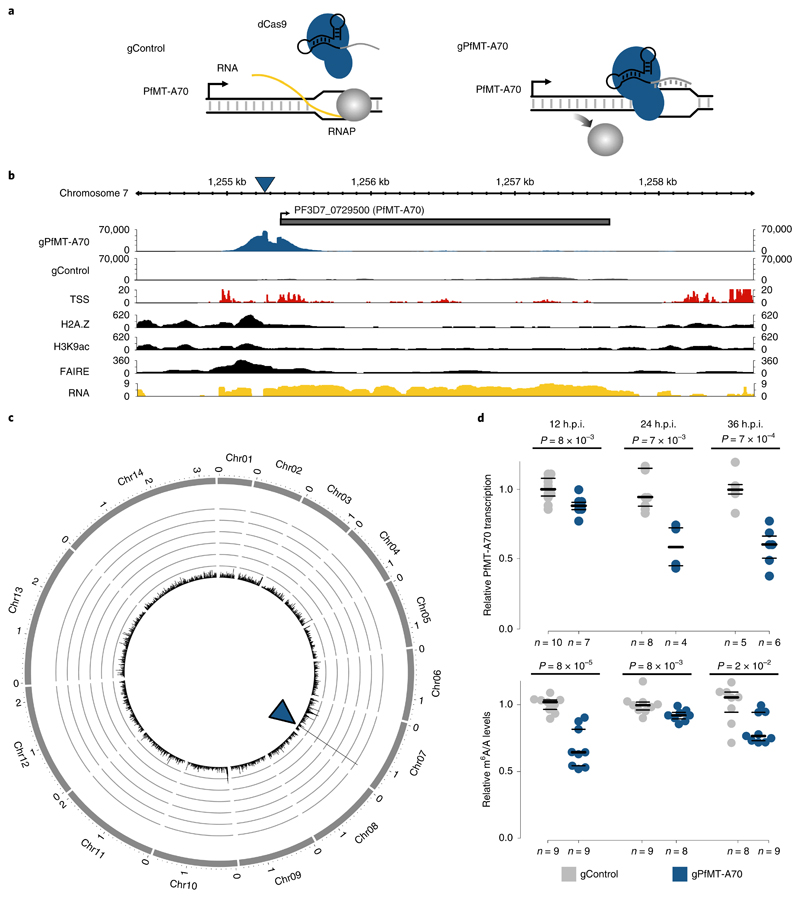
Fig. 3. Knockdown of the PfMT-A70 m6A methyltransferase by CRiSPRi.
a, Diagram of the CRISPR interference system for targeted transcriptional knockdown of PfMT-A70. A non-specific gRNA (gControl) without a binding site in the P. falciparum genome is used as a negative control in all experiments (left). The specific gRNA (gPfMT-A70) targets the PfMT-A70 promoter on the non-template strand downstream of the putative transcription start site, blocking the elongating RNA polymerase II (RNAP) and silencing the target gene (right). b, dCas9-ChIP sequencing (12 h.p.i.) shows enrichment for gPfMT-A70-targeted dCas9 (blue), but not non-targeted dCas9 (gControl in grey) at the targeted upstream region of the PfMT-A70 gene (indicated at the top with a grey bar). Arrow indicates direction of transcription. The blue triangle indicates the location of the gRNA target site. Genomic features investigated in previous studies that define the putative promoter region are shown below: transcription start site (TSS)34, histone 2A variant (H2A.Z)33, acetylation of histone H3 at lysine 9 (H3K9ac)5, nucleosome depletion as determined by FAIRE-seq32 (FAIRE), and RNA-seq coverage (RNA) at the genomic locus6. c, Circos plot of gPfMT-A70 dCas9 ChIP-seq (normalized to gControl) across all 14 nuclear chromosomes (exterior grey bars) shows no substantial enrichment of dCas9-binding other than at the PfMT-A70 promoter (blue arrowhead), demonstrating the high specificity of the method. Chromosome name and length (in megabases) are indicated at the exterior of the plot. The y axis indicates ChIP enrichment on a scale from 0 to 150 RPKM in 1,000 nt windows. dCas ChIP-seq data (b,c) are representative of two independent biological experiments. d, Comparison of PfMT-A70 transcription measured by RT-qPCR (top) and m6A/A measured by LC-MS/MS (bottom) between gControl (grey) and gPfMT-A70 (blue) parasites at three different time points over the IDC (indicated at the top). PfMT-A70 transcript levels were normalized to those of the housekeeping gene serine tRNA ligase (PF3D7_0717700). The number of biological replicates is indicated on the bottom of the graph. P values were calculated using two-sided independent-samples t-test (RT-qPCR) and a two-sided Mann-Whitney U-test (LC-MS/MS). The average of PfMT-A70 transcription and m6A/A levels in gControl parasites were set to 1. Horizontal lines represent median and interquartile ranges.

