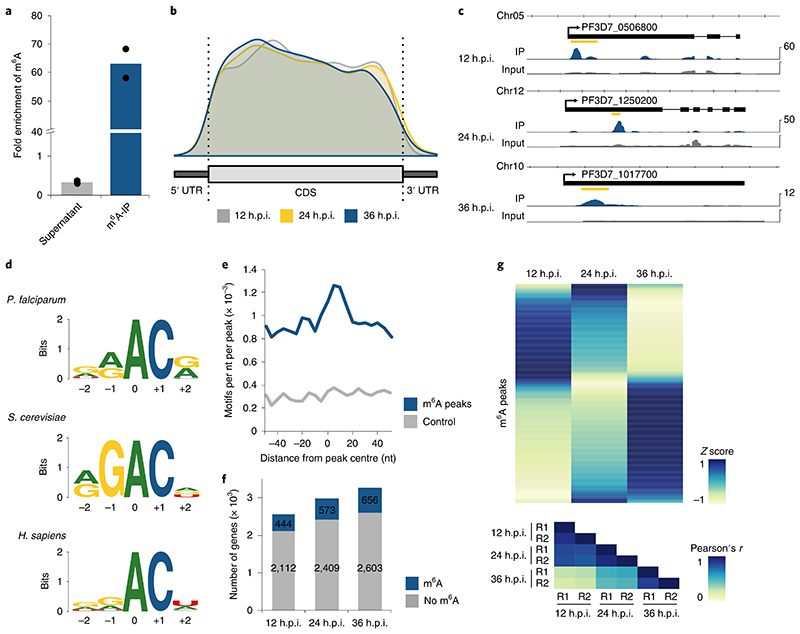
Fig. 4. Differential m6A methylation during the P. falciparum iDC.
a, Fold enrichment of m6A levels as measured by LC-MS/MS in different fractions of the m6A-IP experiment, showing a three-fold depletion in the supernatant and 63-fold enrichment in the eluate. m6A levels were normalized to the total number of adenosines (that is, m6A/A) for each fraction, and fold enrichments were calculated as ratios over the m6A/A levels in the input mRNA sample (collected at 36 h.p.i.). Points represent individual biological replicates, with bars showing the mean. b, Distribution of m6A peak location along a normalized transcript coding sequence (CDS), 500 nt upstream of the start (5’ UTR) and 500 nt downstream of the stop codon (3’ UTR) for peaks identified at 12 (grey), 24 (yellow) and 36 (blue) h.p.i. The total number of identified m6A sites by m6A-seq is likely to be an underestimate. Besides those that were not called due to the conservative annotation approach, m6A sites in transcripts reaching peak expression at different time points or sites in low complexity regions are likely to have been missed. c, Exemplary RNA sequence coverage of m6A-IP (blue) and input (grey) gControl samples showing m6A peaks identified at 12 h.p.i. in PF3D7_0506800 (transcription factor 25; RPKM, 107), 24 h.p.i. in PF3D7_1250200 (CSC1-like protein; RPKM, 53) and at 36 h.p.i. in PF3D7_1017700 (conserved protein of unknown function; RPKM, 10). The location of the m6A peak is indicated by the yellow bar. Data are representative of two independent biological experiments. d, Comparison of the deduced sequence motif of m6A methylation sites in P. falciparum (top), S. cerevisiae (middle)27 and human (bottom)35. The relative height of each nucleotide indicates frequency and the total height at each position represents sequence conservation (‘bits’). The N6-methylated adenosine is located at position 0. e, Density plot showing the occurrence of the consensus motif within ±50 nt of all significant m6A-seq peak summits (blue) and size-matched random control sequences (grey) in 5 nt windows. f, Bar charts indicating the number of transcripts (RPKM ≥5) with no (grey) or at least one significant (blue) m6A peak at three different time points over the IDC. g, Heatmap of average row Z score normalized m6A enrichments in gControl parasites (average derived from n = 2 biologically independent experiments) displaying changes in transcript-specific methylation at three time points throughout the IDC (top). Each row represents an m6A peak (n = 840) in a transcript expressed with RPKM ≥ 5 at all three time points. Bottom: heatmap showing Pearson’s r correlation coefficients of m6A enrichments, demonstrating a high degree of reproducibility between the two replicates (R1 and R2) at each time point. Blue indicates a high Z score while yellow indicates a low Z score (see Methods).

