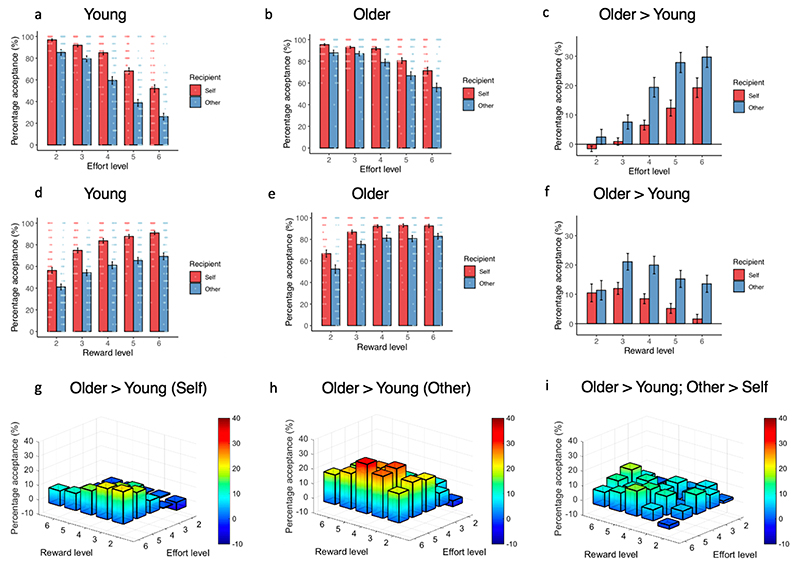
Figure 3. Acceptance rates for choices of ‘working’: Effort and reward varies by age group.
(a) Percentage chosen to work in young adults for different levels of effort. (b) Percentage chosen to work in older adults. (c) Difference in percentage acceptance between young and older adults across effort levels. (d) Percentage chosen to work in young adults for different reward levels. (e) Percentage chosen to work in older adults for different reward levels. (f) Differences in percentage chosen to work in younger adults compared to older adults for different reward levels. (g) 3D plot of choices to work across different effort and reward levels in young compared to older adults for the self condition. (h) 3D plot of choices to work across different effort and reward levels in young compared to older adults for the ‘other’ condition. (i) 3D plot of choices to work across different effort and reward levels in older adults, compared to younger adults, plotted for choices to help other compared to self. Error bars show +/- SEM.

