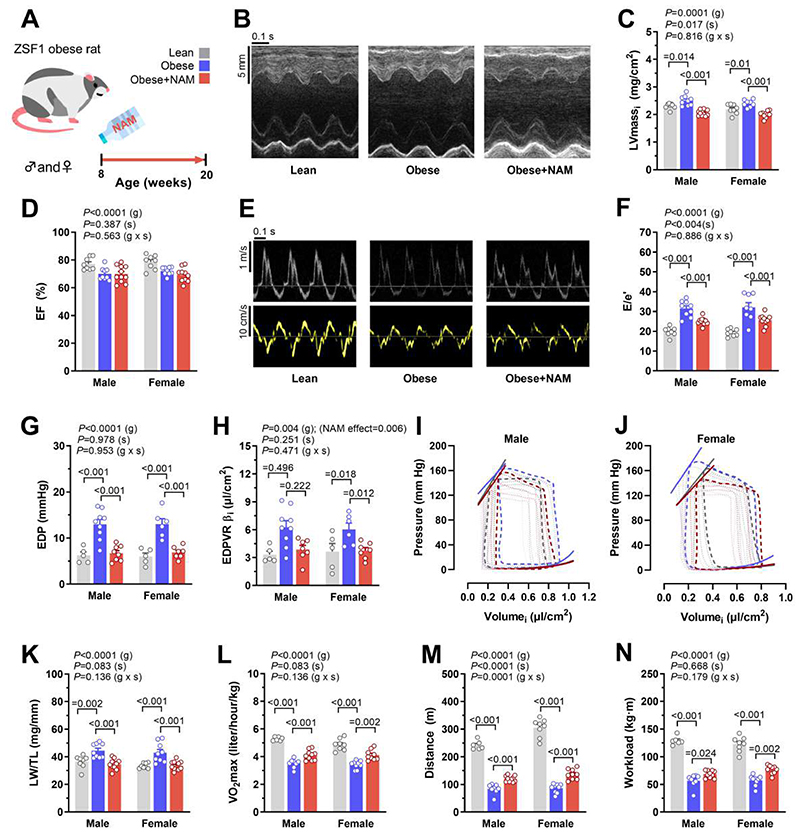
Fig. 1. Oral supplementation of NAM improves diastolic dysfunction in ZSF1 obese rats.
(A) Schematic overview of nicotinamide (NAM) feeding protocol to male and female ZSF1 obese rats with cardiometabolic syndrome and HFpEF. NAM (40 mM) was added to the drinking water starting at the age of 8 weeks and after 3 months cardiac parameters were assessed. (B) Representative echocardiography-derived M-mode tracings, (C) left ventricular mass indexed to body surface area (LVmassi), (D) ejection fraction (EF), (E) representative pulsed-wave Doppler (top) and tissue Doppler (bottom) tracings, and (F) ratio of peak early Doppler transmitral flow velocity (E) to myocardial tissue Doppler velocity (e’), (n=8/9/10 and 8/9/11 rats for lean/obese/obese+NAM in males and females, respectively). (G) Invasive hemodynamic assessment of left ventricular end-diastolic pressure (EDP), (H) myocardial stiffness constant (indexed end-diastolic pressure volume exponential relationship coefficient β. EDPVR βi), (I and J) end-systolic and end-diastolic pressure volume relationships generated by inferior vena cava occlusions with corresponding pressure-volume loops in (I) male and (J) female ZSF1 rats, (n=5/9/8 and 5/6/7 rats for lean/obese/obese+NAM in males and females, respectively). (K) Lung weight normalized to tibia length (LW/TL), (n=8/9/11 rats for lean/obese/obese+NAM in either sex). (L) Maximal oxygen consumption (VO2max), (M) running distance, and (N) workload in ZSF1 rats during exercise exhaustion testing, (n=6/8/10 and 8/9/9 rats for lean/obese/obese+NAM in males and females, respectively). All results were generated from 2 independent cohorts. Indicated P values on top of panels (C and D, F to H, and K to N) represent factor comparisons by a linear mixed model including sex (s) and group (g) as fixed factors and the cohort as a random factor; following comparisons between different groups within the respective sex are indicated by Bonferroni post-hoc test. EDPVR αi was included in the model as a covariate in (F). Bars and error bars show means and SEM, respectively, with individual data points superimposed.

